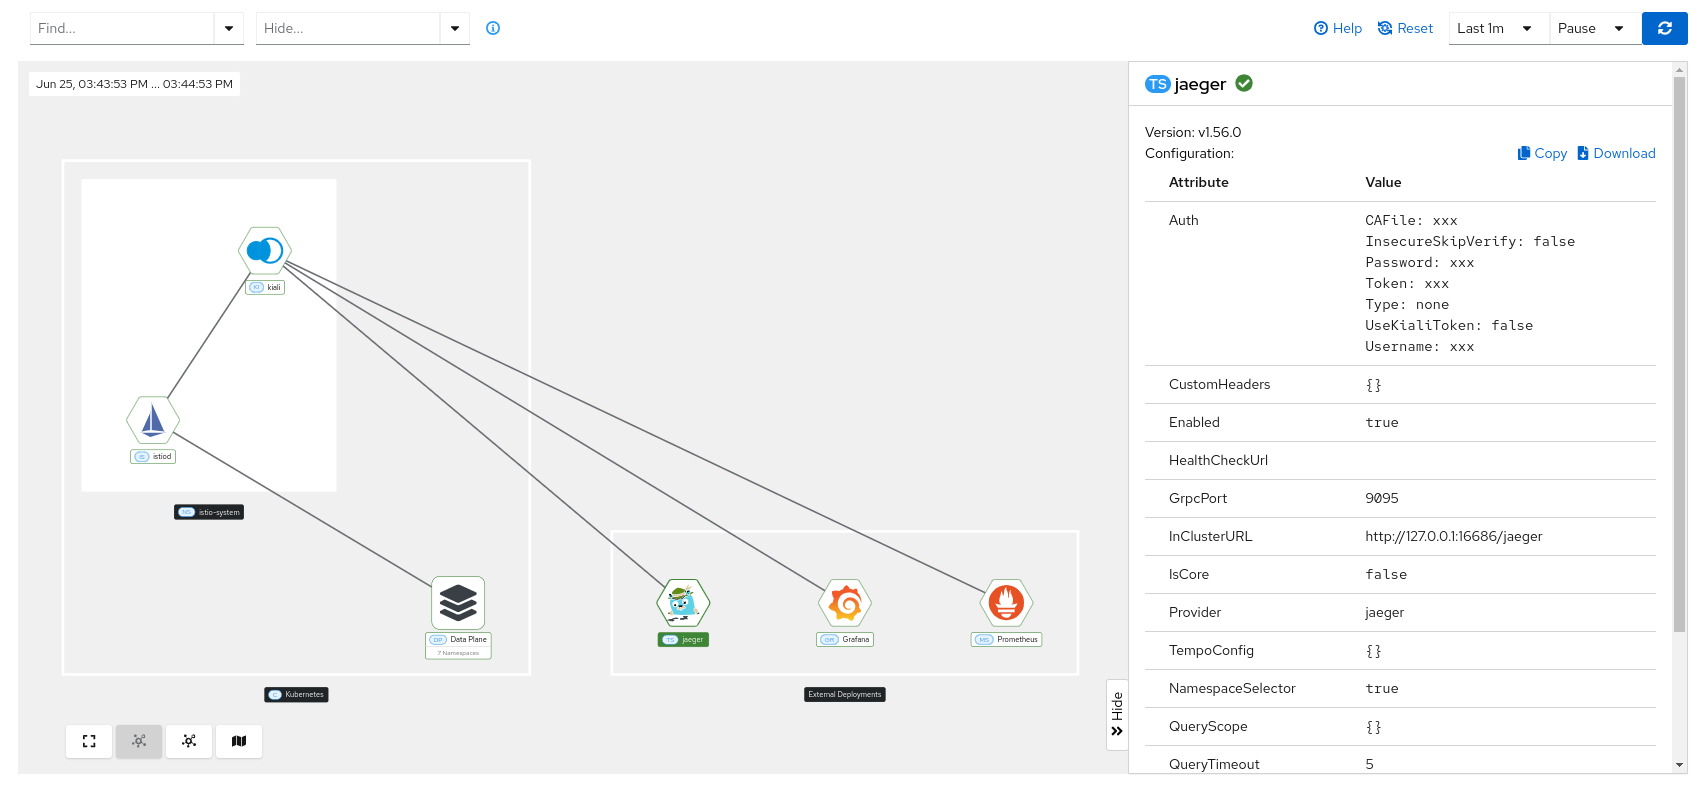
Istio Infrastructure Status
A service mesh simplifies application services by deferring the non-business logic to the mesh. But for healthy applications the service mesh infrastructure must also be running normally. Kiali monitors the multiple components that make up the service mesh, letting you know if there is an underlying problem.

A component status will be one of: Not found, Not ready, Unreachable, Not healthy and Healthy. Not found means that Kiali is not able to find the deployment. Not ready means no pods are running. Unreachable means that Kiali hasn’t been successfully able to communicate with the component (Prometheus, Grafana and Jaeger). Not healthy means that the deployment doesn’t have the desired amount of replicas running. Otherwise, the component is Healthy and it won’t be shown in the list.
Regarding the severity of each component, there are only two options: core or add-on. The core components are those shown as errors (in red) whereas the add-ons are displayed as warnings (in orange).
By default, Kiali checks that the core components “istiod”, “ingress”, and “egress” are installed and running in the control plane namespace, and that the add-ons “prometheus”, “grafana” and “jaeger” are available.
Mesh page
Detailed information about the Istio infrastructure status is displayed on the mesh page. It shows an infrastructure topology view with core and add-on components, their health, and how they are connected to each other.
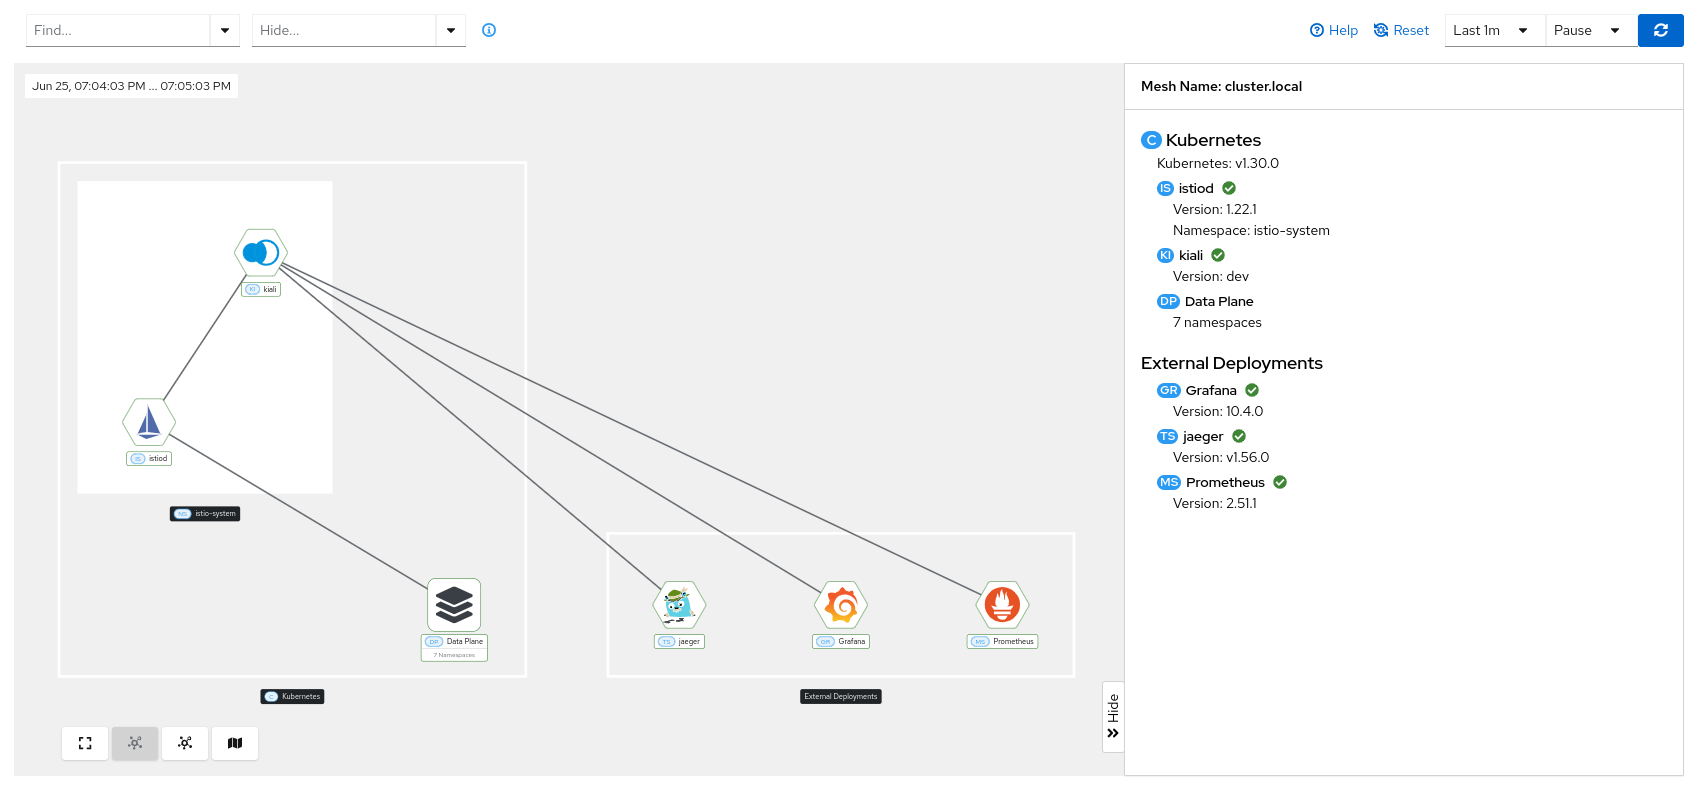
Similar to the traffic graph, the left side of the page shows the topology view, while the right side displays information about the selected node. If no node is selected, global infrastructure information is shown, including the status, version, and cluster of every component.
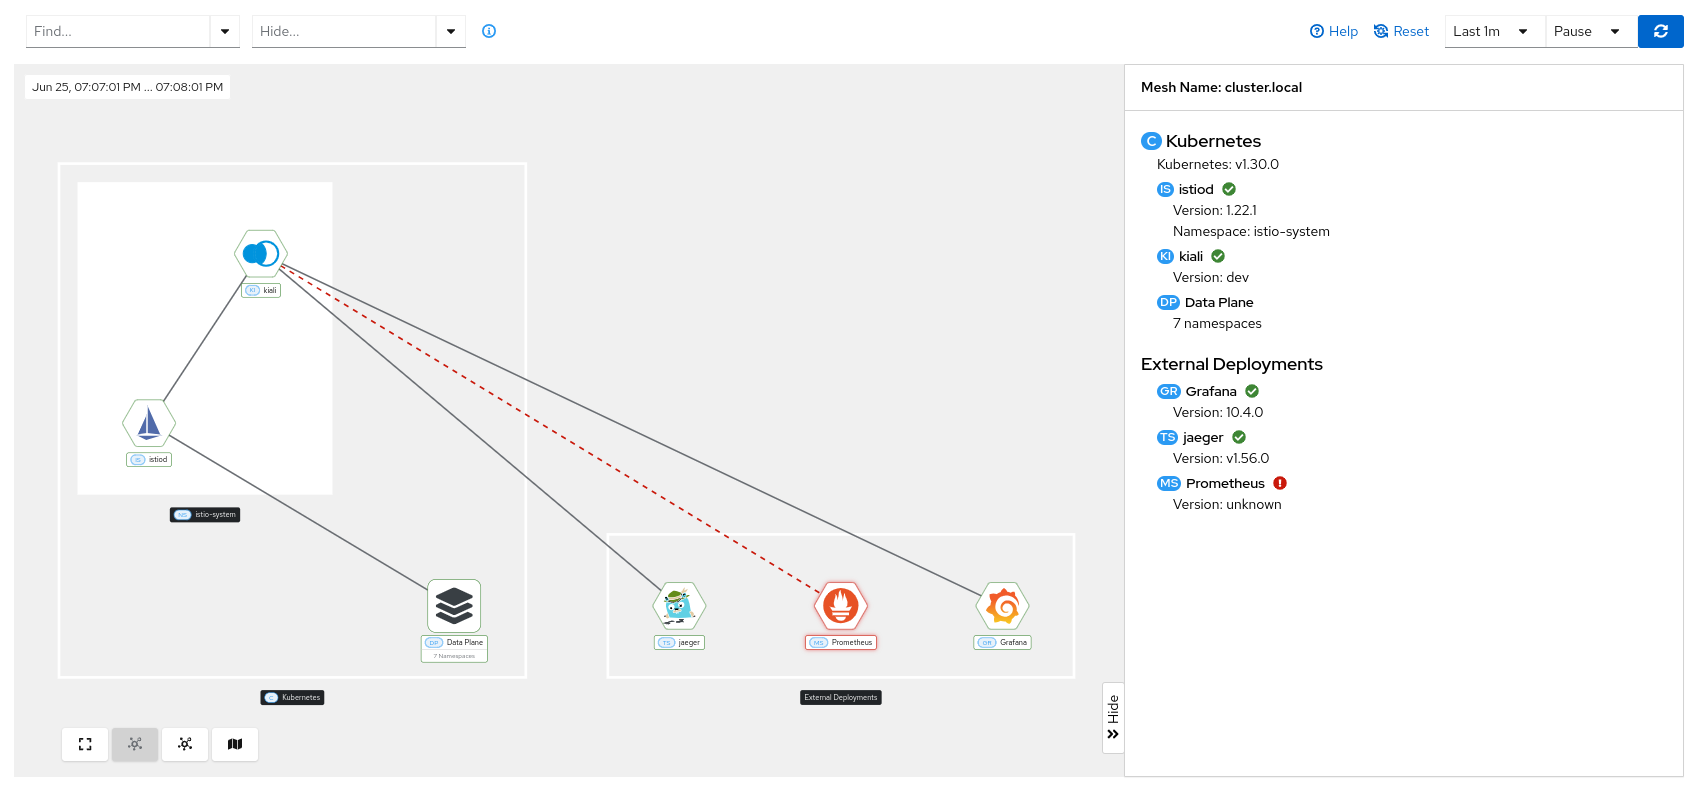
Connection issues between Kiali and any component are indicated with a red dotted line and a red health indicator in the target side panel.
The specific information shown in the target side panel depends on the type of node selected:
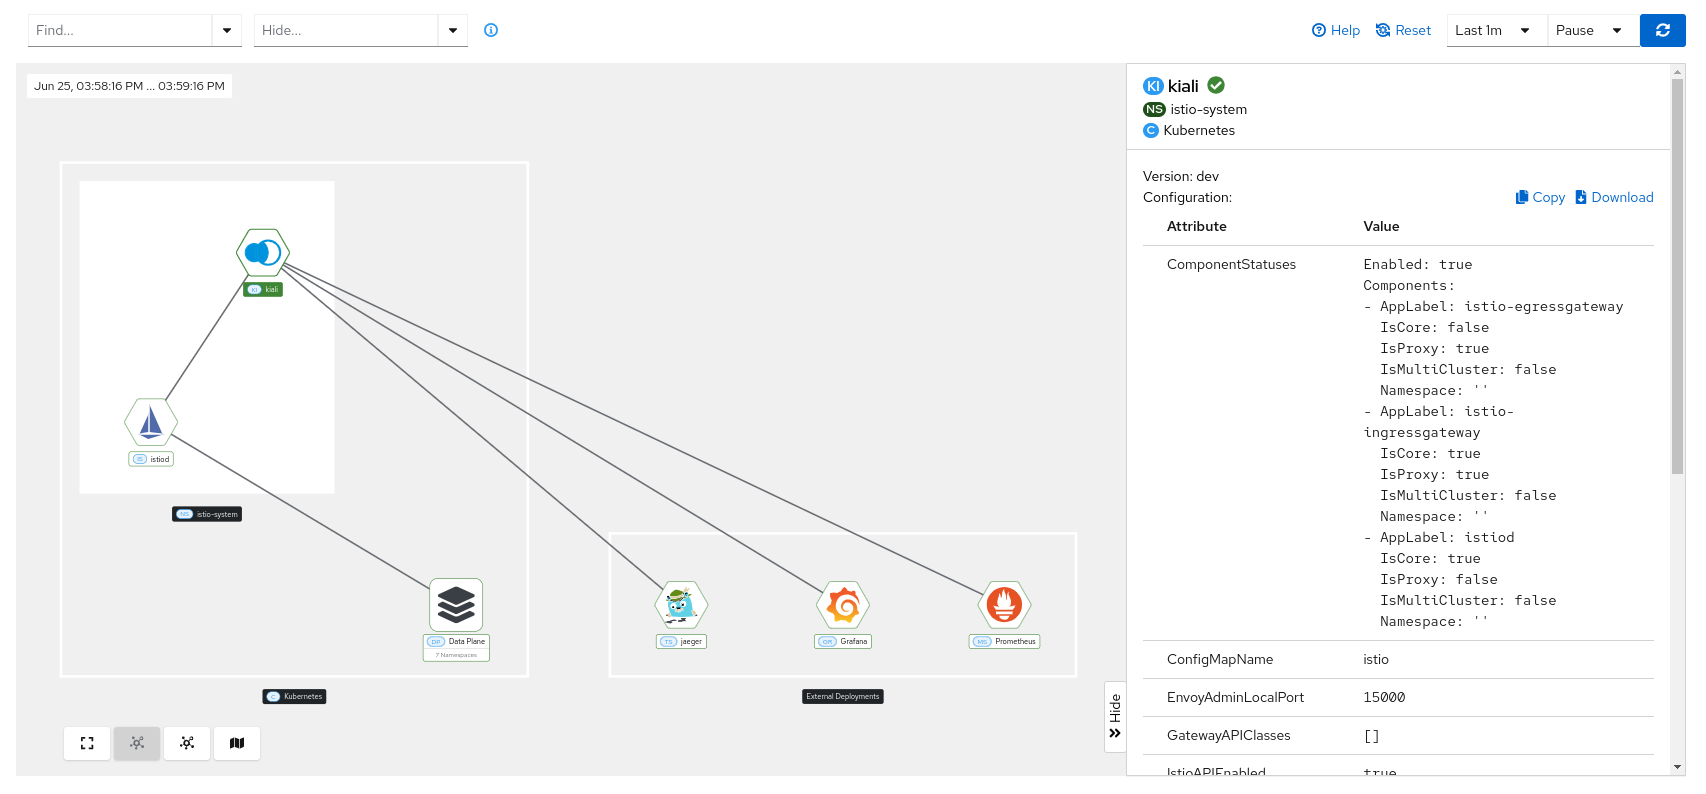
Kiali
When you click on the Kiali node, you can check information such as the version, health status, and configuration values.
Istio control plane
When you click on the Istio control plane, you can check information such as the Istio version, mTLS status, outbound policy, CPU and memory metrics, configuration table, and more.
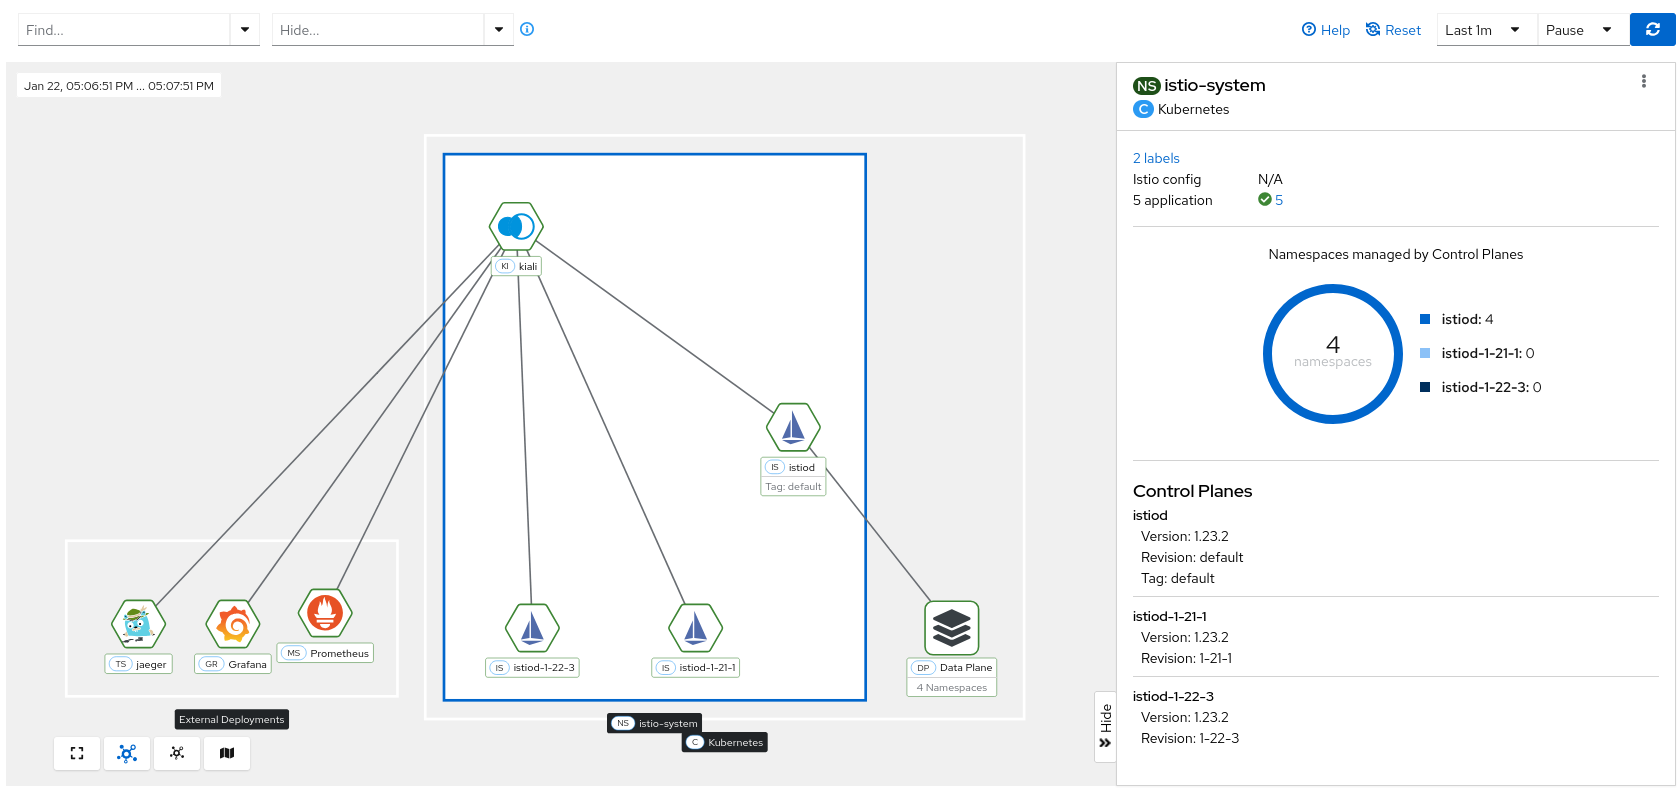
Control plane Namespace
When you click on the control plane namespace box, you can check the numbers of Namespaces managed by Control Planes, this will show the data plane migration status between different versions of Istio installations.
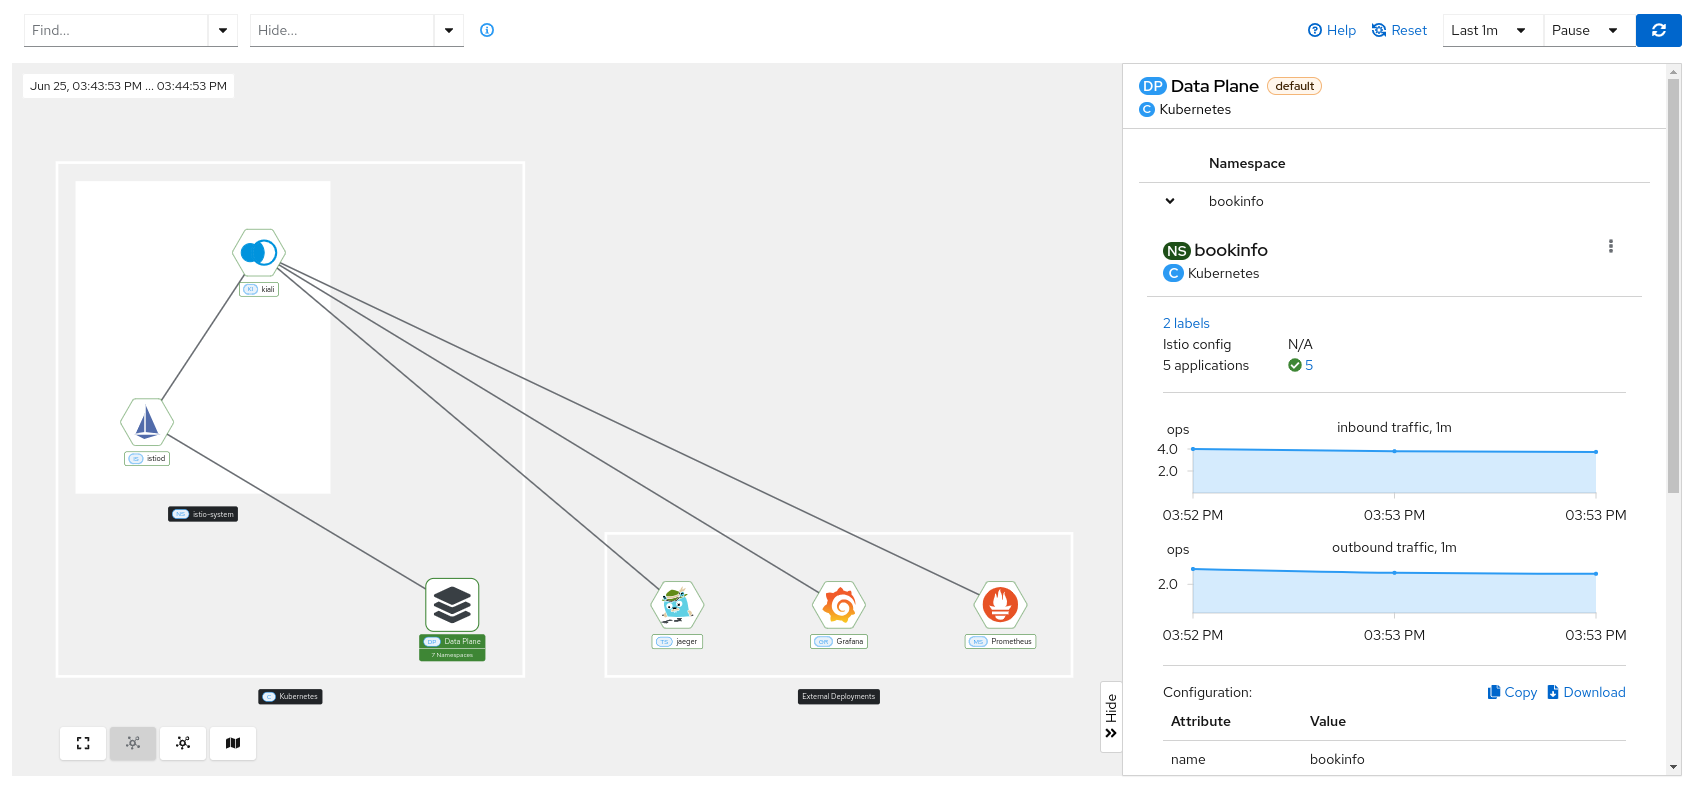
Data plane
When you click on the cluster data plane, you can check the basic information of each namespace belonging to that data plane (Istio configuration, traffic inbound/outbound), similar to what you can see on the overview page.

Add-on components
When you click on the “prometheus”, “grafana” or “jaeger” node, , its health status, version, and configuration values are displayed:
