This is the multi-page printable view of this section.
Click here to print.
Return to the regular view of this page.
Configuration
How to configure Kiali to fit your needs.
The pages in this Configuration section describe most available options for
managing and customizing your Kiali installation.
Unless noted, it is assumed that you are using the Kiali operator and that you
are managing the Kiali installation through a Kiali CR. The provided YAML
snippets for configuring Kiali should be placed in your Kiali CR. For example,
the provided configuration snippet for setting up the Anonymous authentication
strategy is the following:
spec:
  auth:
    strategy: anonymous
You will need to take this YAML snippet and apply it to your Kiali CR. As an example, an almost minimal Kiali CR using the previous configuration snippet would be the following:
apiVersion: kiali.io/v1alpha1
kind: Kiali
metadata:
  namespace: kiali-namespace
  name: kiali
spec:
  deployment:
    namespace: kiali-namespace
  auth:
    strategy: anonymous
Then, you can save the finished YAML file and apply it with kubectl apply -f.
It is recommended that you read
The Kiali CR
and the Example Install
pages of the Installation Guide for more information about using the Kiali CR.
Also, for reference, see Kiali CR Reference which documents all available options.
1 - Authentication Strategies
Choosing and configuring the appropriate authentication strategy.
Kiali supports five authentication mechanisms.
- The default authentication strategy for OpenShift clusters is
openshift.
- The default authentication strategy for all other Kubernetes clusters is
token.
All mechanisms other than anonymous support limiting per-user namespace access control.
For multi-cluster, only anonymous and openid are currently supported.
Read the dedicated page of each authentication strategy to learn more.
1.1 - Anonymous strategy
Access Kiali with no authentication.
Introduction
The anonymous strategy removes any authentication requirement. Users will
have access to Kiali without providing any credentials.
Although the anonymous strategy doesn’t provide any access protection, it’s
valid for some use-cases. Some examples known from the community:
- Exposing Kiali through a reverse proxy, where the reverse proxy is providing a custom authentication mechanism.
- Exposing Kiali on an already limited network of trusted users.
- When Kiali is accessed through
kubectl port-forward or alike commands that allow usage of the cluster’s RBAC capabilities to limit access.
- When developing Kiali, where a developer has a private instance on his own machine.
It’s worth to emphasize that the anonymous
strategy will leave Kiali unsecured. If you are using this option, make sure
that Kiali is available only to trusted users, or access is protected by other
means.
Set-up
To use the anonymous strategy, use the following configuration in the Kiali CR:
spec:
  auth:
    strategy: anonymous
The anonymous strategy doesn’t have any additional configuration.
Access control
When using the anonymous strategy, the content displayed in Kiali is based on
the permissions of the Kiali service account. By default, the Kiali service
account has cluster wide access and will be able to display everything in the
cluster.
OpenShift
If you are running Kiali in OpenShift, access can be customized by changing
privileges to the Kiali ServiceAccount. For example, to reduce permissions to
individual namespaces, first, remove the cluster-wide permissions granted by
default:
oc delete clusterrolebindings kiali
Then grant the kiali role only in needed namespaces. For example:
oc adm policy add-role-to-user kiali system:serviceaccount:istio-system:kiali-service-account -n ${NAMESPACE}
View only
You can tell the Kiali Operator to install Kiali in “view only”
mode (this does work for either OpenShift or Kubernetes). You do this by
setting the view_only_mode to true in the Kiali CR, which
allows Kiali to read service mesh resources found in the cluster, but it does
not allow any change:
spec:
  deployment:
    view_only_mode: true
1.2 - Header strategy
Run Kiali behind a reverse proxy responsible for injecting the user’s token, or a token with impersonation.
Introduction
The header strategy assumes a reverse proxy is in front of Kiali, such as
OpenUnison or OAuth2 Proxy, injecting the user’s identity into each request to
Kiali as an Authorization header. This token can be an OpenID Connect
token or any other token the cluster recognizes.
In addition to a user token, the header strategy supports impersonation
headers. If the impersonation headers are present in the request, then Kiali
will act on behalf of the user specified by the impersonation (assuming the
token supplied in the Authorization header is authorized to do so).
The header strategy allows for namespace access control.
The header strategy is only supported for single cluster.
Set-up
The header strategy will work with any Kubernetes cluster. The token provided
must be supported by that cluster. For instance, most “on-prem” clusters support
OpenID Connect, but cloud hosted clusters do not. For clusters that don’t support
a token, the impersonation
headers can be injected by the reverse proxy.
spec:
  auth:
    strategy: header
The header strategy doesn’t have any additional configuration.
The header strategy looks for a token in the Authorization HTTP header with the
Bearer prefix. The HTTP header should look like:
Authorization: Bearer TOKEN
Where TOKEN is the appropriate token for your cluster. This TOKEN will be
submitted to the API server via a TokenReview to validate the token ONLY
on the first access to Kiali. On subsequent calls the TOKEN is passed through
directly to the API server.
Security Considerations
Network Policies
A policy should be put in place to make sure that the only “client” for Kiali is
the authenticating reverse proxy. This helps limit potential abuse and ensures
that the authenticating reverse proxy is the source of truth for who accessed
Kiali.
Short Lived Tokens
The authenticating reverse proxy should inject a short lived token in the
Authorization header. A shorter lived token is less likely to be abused if
leaked. Kiali will take whatever token is passed into the reqeuest, so as tokens
are regenerated Kiali will use the new token.
Impersonation
TokenRequest API
The authenticating reverse proxy should use the TokenRequest API instead of static
ServiceAccount tokens when possible while using impersonation. The
ServiceAccount that can impersonate users and groups is privileged and having it
be short lived cuts down on the possibility of a token being leaked while it’s being
passed between different parts of the infrastructure.
The authenticating proxy MUST drop any headers it receives from a remote client
that match the impersonation headers. Not only do you want to make sure that the
authenticating proxy can’t be overriden on which user to authenticate, but also
what groups they’re a member of.
1.3 - OpenID Connect strategy
Access Kiali requiring authentication through a third-party OpenID Connect provider.
Introduction
The openid authentication strategy lets you integrate Kiali to an external
identity provider that implements OpenID Connect, and allows
users to login to Kiali using their existing accounts of a
third-party system.
If your
Kubernetes cluster is also integrated with your OpenId provider,
then Kiali’s openid strategy can offer
namespace access control.
Kiali only supports the authorization code flow of the OpenId Connect spec.
Requirements
The Kiali’s signing key needs to be 16, 24
or 32 byte long. If you install Kiali via the operator and don’t set a custom
signing key, the operator should create a 16 byte long signing key.
If you don’t need namespace access control support, you can use any
working OpenId Server where Kiali can be configured as a client application.
If you do need namespace access control support, you need either:
The first option is preferred if you can manipulate your cluster API server
startup flags, which will result in your cluster to also be integrated with the
external OpenID provider.
The second option is provided for cases where you are using a managed
Kubernetes and your cloud provider does not support configuring OpenID
integration. Kiali assumes an implementation of a Kubernetes API server. For
example, a community user has reported to successfully configure Kiali’s OpenID
strategy by using
kube-oidc-proxy which is a
reverse proxy that handles the OpenID authentication and forwards the
authenticated requests to the Kubernetes API.
Set-up with namespace access control support
Assuming you already have a working Kubernetes cluster with OpenId integration
(or a working alternative like kube-oidc-proxy), you should already had
configured an application or a client in your OpenId server (some cloud
providers configure this app/client automatically for you). You must re-use
this existing application/client by adding the root path of your Kiali
instance as an allowed/authorized callback URL. If the OpenID server provided
you a client secret for the application/client, or if you had manually set a
client secret, issue the following command to create a Kubernetes secret
holding the OpenId client secret:
kubectl create secret generic kiali --from-literal="oidc-secret=$CLIENT_SECRET" -n $NAMESPACE
where $NAMESPACE is the namespace where you installed Kiali and
$CLIENT_SECRET is the secret you configured or provided by your OpenId
Server. If Kiali is already running, you may need to restart the Kiali pod so
that the secret is mounted in Kiali.
It’s worth emphasizing that to configure OpenID
integration you must re-use the OpenID application/client that you created for
your Kubernetes cluster. If you create a new application/client for Kiali in
your OpenId server, Kiali will fail to properly authenticate users.
Then, to enable the OpenID Connect strategy, the minimal configuration you need to
set in the Kiali CR is like the following:
spec:
  auth:
    strategy: openid
    openid:
      client_id: "kiali-client"
      issuer_uri: "https://openid.issuer.com"
This assumes that your Kubernetes cluster is configured with OpenID Connect
integration. In this case, the client-id and issuer_uri attributes must
match the --oidc-client-id and --oidc-issuer-url flags
used to start the cluster API server.
If these values don’t match, users will fail to login to Kiali.
If you are using a replacement or a reverse proxy for the Kubernetes API
server, the minimal configuration is like the following:
spec:
  auth:
    strategy: openid
    openid:
      api_proxy: "https://proxy.domain.com:port"
      api_proxy_ca_data: "..."
      client_id: "kiali-client"
      issuer_uri: "https://openid.issuer.com"
The value of client-id and issuer_uri must match the values of the
configuration of your reverse proxy or cluster API replacement. The api_proxy
attribute is the URI of the reverse proxy or cluster API replacement (only
HTTPS is allowed). The api_proxy_ca_data is the public certificate authority
file encoded in a base64 string, to trust the secure connection.
Set-up with no namespace access control support
Register Kiali as a client application in your OpenId Server. Use the root path
of your Kiali instance as the callback URL. If the OpenId Server provides you a
client secret, or if you manually set a client secret, issue the following
command to create a Kubernetes secret holding the OpenId client secret:
kubectl create secret generic kiali --from-literal="oidc-secret=$CLIENT_SECRET" -n $NAMESPACE
where $NAMESPACE is the namespace where you installed Kiali and
$CLIENT_SECRET is the secret you configured or provided by your OpenId
Server. If Kiali is already running, you may need to restart the Kiali pod so
that the secret is mounted in Kiali.
Then, to enable the OpenID Connect strategy, the minimal configuration you need
to set in the Kiali CR is like the following:
spec:
  auth:
    strategy: openid
    openid:
      client_id: "kiali-client"
      disable_rbac: true
      issuer_uri: "https://openid.issuer.com"
As namespace access control is disabled, all users logging into Kiali
will share the same cluster-wide privileges.
Additional configurations
Configuring the displayed user name
The Kiali front-end will, by default, retrieve the string of the sub claim of
the OpenID token and display it as the user name. You can customize which field
to display as the user name by setting the username_claim attribute of the
Kiali CR. For example:
spec:
  auth:
    openid:
      username_claim: "email"
If you enabled namespace access control, you will want the username_claim
attribute to match the --oidc-username-claim flag used to start the
Kubernetes API server, or the equivalent option if you are using a replacement
or reverse proxy of the API server. Else, any user-friendly claim will be OK as
it is purely informational.
By default, Kiali will request access to the openid, profile and email
standard scopes. If you need a different set of scopes, you can set the
scopes attribute in the Kiali CR. For example:
spec:
  auth:
    openid:
      scopes:
      - "openid"
      - "email"
      - "groups"
The openid scope is forced. If you don’t add it to the list of scopes to
request, Kiali will still request it from the identity provider.
Configuring authentication timeout
When the user is redirected to the external authentication system, by default
Kiali will wait at most 5 minutes for the user to authenticate. After that time
has elapsed, Kiali will reject authentication. You can adjust this timeout by
setting the authentication_timeout with the number of seconds that Kiali
should wait at most. For example:
spec:
  auth:
    openid:
      authentication_timeout: 60 # Wait only one minute.
Configuring allowed domains
Some identity providers use a shared login and regardless of configuring your
own application under your domain (or organization account), login can succeed
even if the user that is logging in does not belong to your account or
organization. Google is an example of this kind of provider.
To prevent foreign users from logging into your Kiali instance, you can
configure a list of allowed domains:
spec:
  auth:
    openid:
      allowed_domains:
      - example.com
      - foo.com
The e-mail reported by the identity provider is used for the validation. Login
will be allowed if the domain part of the e-mail is listed as an allowed
domain; else, the user will be rejected. Naturally, you will need to
configure the email scope to be requested.
There is a special case: some identity providers include a hd claim in the
id_token. If this claim is present, this is used instead of extracting the
domain from the user e-mail. For example, Google Workspace (aka G Suite)
includes this hd claim for hosted
domains.
Using an OpenID provider with a self-signed certificate
If your OpenID provider is using a self-signed certificate, you can disable
certificate validation by setting the insecure_skip_verify_tls to true in
the Kiali CR:
spec:
  auth:
    openid:
      insecure_skip_verify_tls: true
You should use self-signed certificates only for
testing purposes.
However, if your organization or internal network has an internal trusted
certificate authority (CA), and your OpenID server is using a certificate
issued by this CA, you can configure Kiali to trust certificates from this CA
rather than disabling verification.
See the TLS Configuration
page for detailed instructions on configuring custom CA certificates. You can use either
the global additional-ca-bundle.pem key (which makes the CA trusted for all
HTTPS connections) or the OpenID-specific openid-server-ca.crt key in the
kiali-cabundle ConfigMap.
Using an HTTP/HTTPS Proxy
In some network configurations, there is the need to use proxies to connect to
the outside world. OpenID requires outside world connections to get metadata and
do key validation, so you can configure it by setting the http_proxy and
https_proxy keys in the Kiali CR. They use the same format as the HTTP_PROXY
and HTTPS_PROXY environment variables.
spec:
  auth:
    openid:
      http_proxy: http://USERNAME:PASSWORD@10.0.1.1:8080/
      https_proxy: https://USERNAME:PASSWORD@10.0.0.1:8080/
Passing additional options to the identity provider
When users click on the Login button on Kiali, a redirection occurs to the
authentication page of the external identity provider. Kiali sends a fixed set
of parameters to the identity provider to enable authentication. If you need to
add an additional set of parameters to your identity provider, you can use the
additional_request_params setting of the Kiali CR, which accepts key-value
pairs. For example:
spec:
  auth:
    openid:
      additional_request_params:
        prompt: login
The prompt parameter is a
standard OpenID parameter.
When the login value is passed in this parameter, the
identity provider is instructed to ask for user credentials regardless if the
user already has an active session because of a previous login in some other
system.
If your OpenId provider supports other non-standard parameters, you can specify
the ones you need in this additional_request_params setting.
Take into account that you should not add the client_id, response_type,
redirect_uri, scope, nonce nor state parameters to this list. These are
already in use by Kiali and some already have a dedicated setting.
Provider-specific instructions
Using with Keycloak
When using OpenId with Keycloak, you will need to enable the Standard Flow Enabled
option on the Client (in the Administration Console):
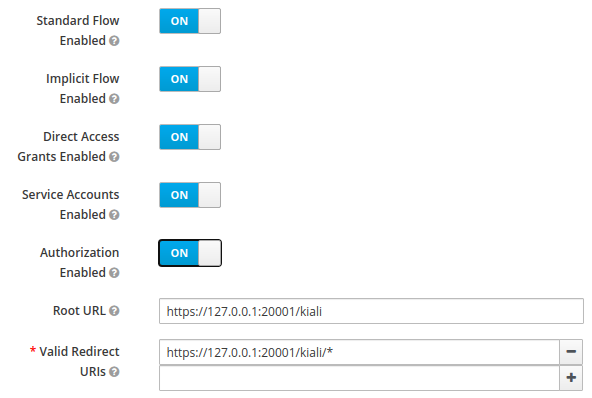
The Standard Flow described on the options is the same as the authorization
code flow from the rest of the documentation.
If you are using Google Cloud Platform (GCP) and its products such as
Google Kubernetes Engine (GKE), it should be straightforward to configure Kiali’s OpenID
strategy to authenticate using your Google credentials.
First, you’ll need to go to your GCP Project and to the Credentials screen which
is available at (Menu Icon) > APIs & Services > Credentials.
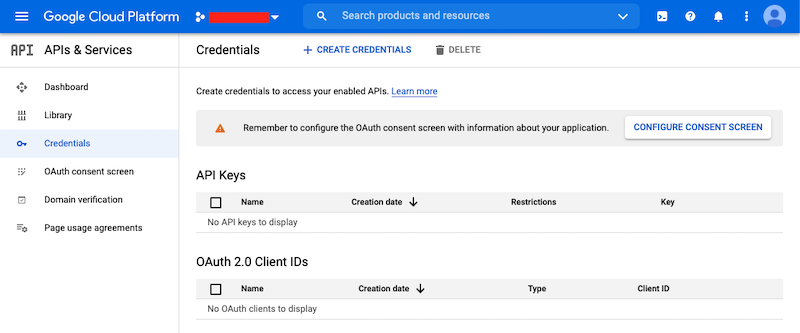
On the Credentials screen you can select to create a new OAuth client ID.
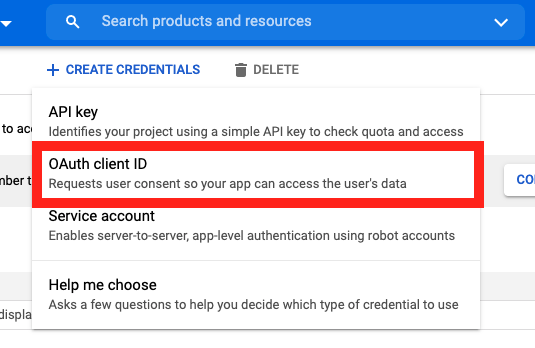
If you’ve never setup the OAuth consent screen you will need to
do that before you can create an OAuth client ID. On screen you’ll have multiple
warnings and prompts to walk you through this.
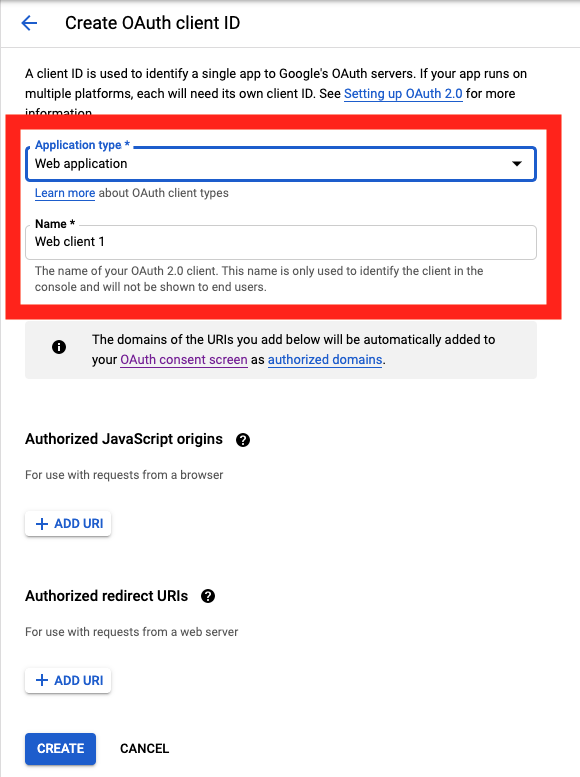
On the Create OAuth client ID screen, set the Application type to Web Application
and enter a name for your key.
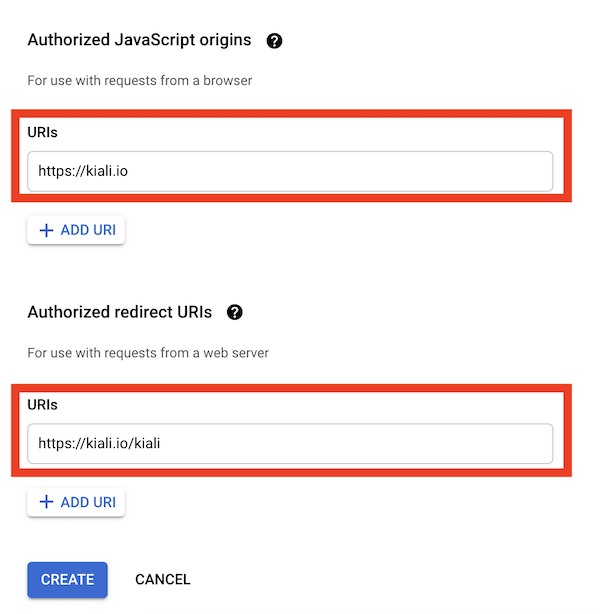
Then enter in the Authorized Javascript origins and Authorized redirect URIs for your project.
You can enter in localhost as appropriate during testing. You can also enter multiple URIs as appropriate.
After clicking Create you’ll be shown your newly minted client id and secret. These are important
and needed for your Kiali CR yaml and Kiali secrets files.
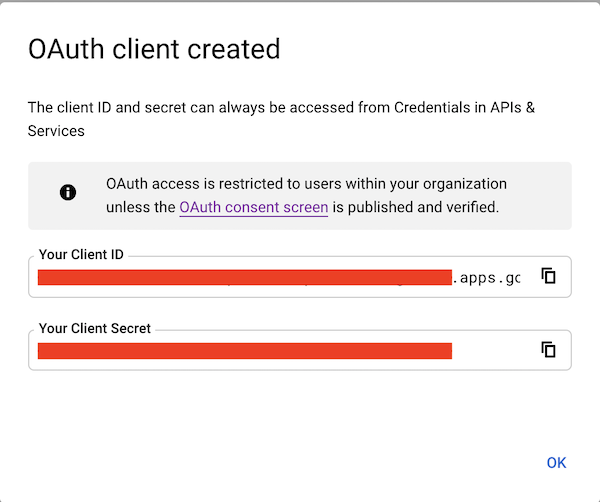
You’ll need to update your Kiali CR file to include the following auth block.
spec:
  auth:
    strategy: "openid"
    openid:
      client_id: "<your client id from GCP>"
      disable_rbac: true
      issuer_uri: "https://accounts.google.com"
      scopes: ["openid", "email"]
      username_claim: "email"
Don’t get creative here. The issuer_uri should be https://accounts.google.com.
Finally you will need to create a secret, if you don’t have one already, that sets the oidc-secret for the openid flow.
apiVersion: v1
kind: Secret
metadata:
  name: kiali
  namespace: istio-system
  labels:
    app: kiali
type: Opaque
data:
  oidc-secret: "<base64 encode your client secret from GCP and enter here>"
Once all these settings are complete just set your Kiali CR and the Kiali secret to your cluster. You may need to
refresh your Kiali Pod to set the Secret if you add the Secret after the Kiali pod is created.
Using with OpenShift and an external OIDC provider
Starting with OpenShift 4.20, you can configure your OpenShift cluster to
authenticate users against an external OpenID Connect (OIDC) provider instead
of using the built-in OAuth server. This is sometimes called
“Bring Your Own OIDC” (BYO OIDC). When OpenShift is configured this way, Kiali
can use the openid authentication strategy with full namespace access control
support.
This section applies when you want to use an external OIDC provider (such as
Keycloak, Okta, Auth0, or others) with OpenShift. If you want to use
OpenShift’s built-in OAuth server, use the
openshift authentication
strategy instead.
Prerequisites
- OpenShift 4.20 or later
- An external OIDC provider configured and accessible from your OpenShift cluster
- The OIDC provider must be configured as an authentication source for both
OpenShift and Kiali (they share the same provider)
- A certificate-based kubeconfig or long-lived service account token for
emergency cluster access (the built-in OAuth will be disabled)
First, configure your OpenShift cluster to use your external OIDC provider.
This involves modifying the cluster’s Authentication resource to specify your
OIDC provider details.
Refer to the official OpenShift documentation for detailed instructions:
Enabling direct authentication with an external OIDC identity provider.
The key configuration elements include:
- Issuer URL: The URL of your OIDC provider
- Client ID: The OAuth2 client ID registered with your OIDC provider
- Audiences: The list of acceptable audiences for tokens (must include your Kiali client ID)
- Username claim mapping: How the OIDC token claims map to Kubernetes usernames
- Username prefix: Optional prefix to distinguish OIDC users (e.g.,
oidc:)
- CA certificate: If your OIDC provider uses a private CA
webhookTokenAuthenticator: null: Must be set when type is OIDC
When OpenShift is configured with external OIDC authentication, the built-in
OAuth server is disabled. This means:
- Users cannot log in using OpenShift’s standard login page
- The
OAuthClient API becomes unavailable
- Keep a certificate-based kubeconfig (or other long-lived admin credentials) available for emergency access because the normal OAuth login paths and OAuth APIs are unavailable in this mode
Ensure your OIDC provider is properly configured and you have set up RBAC
policies before enabling external OIDC authentication.
When using external OIDC with OpenShift, user identities in Kubernetes are
derived from the OIDC token claims. OpenShift typically adds a configurable
prefix to the username (e.g., oidc:) to distinguish OIDC users from other
identity sources.
For example, if your OIDC provider returns user@example.com in the email
claim and you configured a prefix of oidc:, the Kubernetes username becomes
oidc:user@example.com.
Create RBAC resources to grant users access to the namespaces they need. See
Namespace access control for details on the required
privileges.
Example Role and RoleBinding to grant a user access to the istio-system namespace:
apiVersion: rbac.authorization.k8s.io/v1
kind: Role
metadata:
  name: kiali-user-access
  namespace: istio-system
rules:
- apiGroups: [""]
  resources:
  - namespaces
  - pods/log
  verbs:
  - get
---
apiVersion: rbac.authorization.k8s.io/v1
kind: RoleBinding
metadata:
  name: kiali-user-access
  namespace: istio-system
subjects:
- kind: User
  name: "oidc:user@example.com"  # Use the prefixed username
  apiGroup: rbac.authorization.k8s.io
roleRef:
  kind: Role
  name: kiali-user-access
  apiGroup: rbac.authorization.k8s.io
The username prefix (e.g., oidc:) is configured in OpenShift’s
Authentication resource under spec.oidcProviders[].claimMappings.username.prefix.prefixString.
Make sure your RBAC resources use the same prefixed username format.
Step 3: Create the OIDC client secret
If your OIDC provider requires a client secret, create a Kubernetes secret to
store it:
oc create secret generic kiali --from-literal="oidc-secret=$CLIENT_SECRET" -n istio-system
Replace $CLIENT_SECRET with the client secret from your OIDC provider.
If your OIDC provider uses a certificate issued by a private CA (not a public
CA), you need to configure Kiali to trust it. Create a ConfigMap with the CA
certificate:
apiVersion: v1
kind: ConfigMap
metadata:
  name: kiali-cabundle
  namespace: istio-system
data:
  openid-server-ca.crt: |
    -----BEGIN CERTIFICATE-----
    MIIDxTCCAq2gAwIBAgIQAqxcJmoLQ...
    ... (your OIDC provider's CA certificate) ...
    -----END CERTIFICATE-----
See TLS Configuration
for more details on configuring custom CA certificates.
Configure Kiali to use the openid authentication strategy. The client_id
and issuer_uri must match the values configured in OpenShift’s
Authentication resource:
spec:
  auth:
    strategy: openid
    openid:
      client_id: "kiali-client"
      issuer_uri: "https://your-oidc-provider.example.com"
      scopes:
      - "openid"
      - "email"
      username_claim: "email"
The client_id must be listed in the audiences array of your OpenShift OIDC
configuration, and the issuer_uri must exactly match the issuer URL configured
in OpenShift. If these don’t match, authentication will fail.
Important configuration notes:
username_claim: Should match the claim mapping configured in OpenShift
(commonly email or preferred_username)scopes: Request the scopes that provide the claims you need (typically
openid and email)disable_rbac: Do not set this to true if you want per-user
namespace access control. When disable_rbac is false (the default), Kiali
uses the user’s OIDC token for Kubernetes API calls, enabling per-user RBAC.
Complete example
Here’s a complete example of the Kiali CR configuration for OpenShift with an
external OIDC provider:
apiVersion: kiali.io/v1alpha1
kind: Kiali
metadata:
  name: kiali
  namespace: istio-system
spec:
  auth:
    strategy: openid
    openid:
      client_id: "kiali-client"
      issuer_uri: "https://your-oidc-provider.example.com"
      scopes:
      - "openid"
      - "email"
      username_claim: "email"
With the supporting resources:
# OIDC client secret (if required by your provider)
apiVersion: v1
kind: Secret
metadata:
  name: kiali
  namespace: istio-system
type: Opaque
stringData:
  oidc-secret: "your-client-secret-here"
---
# CA certificate (if using a private CA)
apiVersion: v1
kind: ConfigMap
metadata:
  name: kiali-cabundle
  namespace: istio-system
data:
  openid-server-ca.crt: |
    -----BEGIN CERTIFICATE-----
    ... (your CA certificate) ...
    -----END CERTIFICATE-----
---
# RBAC for a user (repeat for each user/namespace combination)
apiVersion: rbac.authorization.k8s.io/v1
kind: Role
metadata:
  name: kiali-user-access
  namespace: istio-system
rules:
- apiGroups: [""]
  resources:
  - namespaces
  - pods/log
  verbs:
  - get
---
apiVersion: rbac.authorization.k8s.io/v1
kind: RoleBinding
metadata:
  name: kiali-user-access
  namespace: istio-system
subjects:
- kind: User
  name: "oidc:user@example.com"
  apiGroup: rbac.authorization.k8s.io
roleRef:
  kind: Role
  name: kiali-user-access
  apiGroup: rbac.authorization.k8s.io
Using with Azure: AKS and AAD
The OpenID authentication strategy can be used
with Azure Kubernetes Service (AKS) and Azure Active Directory (AAD) with Kiali
versions 1.33 and later. Prior Kiali versions do not support namespace access control on Azure.
AKS has support for a feature named AKS-managed Azure Active Directory, which
enables integration between AKS and AAD. This has the advantage that users can
use their AAD credentials to access AKS clusters and can also use Kubernetes
RBAC features to assign privileges to AAD users.
However, Azure is implementing this integration via the
Kubernetes Webhook Token Authentication
rather than via the Kubernetes OpenID Connect Tokens authentication
(see the Azure AD integration section in AKS Concepts documentation).
Because of this difference, authentication in AKS behaves slightly different from a standard
OpenID setup, but Kiali’s OpenID authentication strategy can still be used with
namespace access control support by following the next steps.
First, enable the AAD integration on your AKS cluster. See the
official AKS documentation to learn how.
Once it is enabled, your AKS panel should show the following:
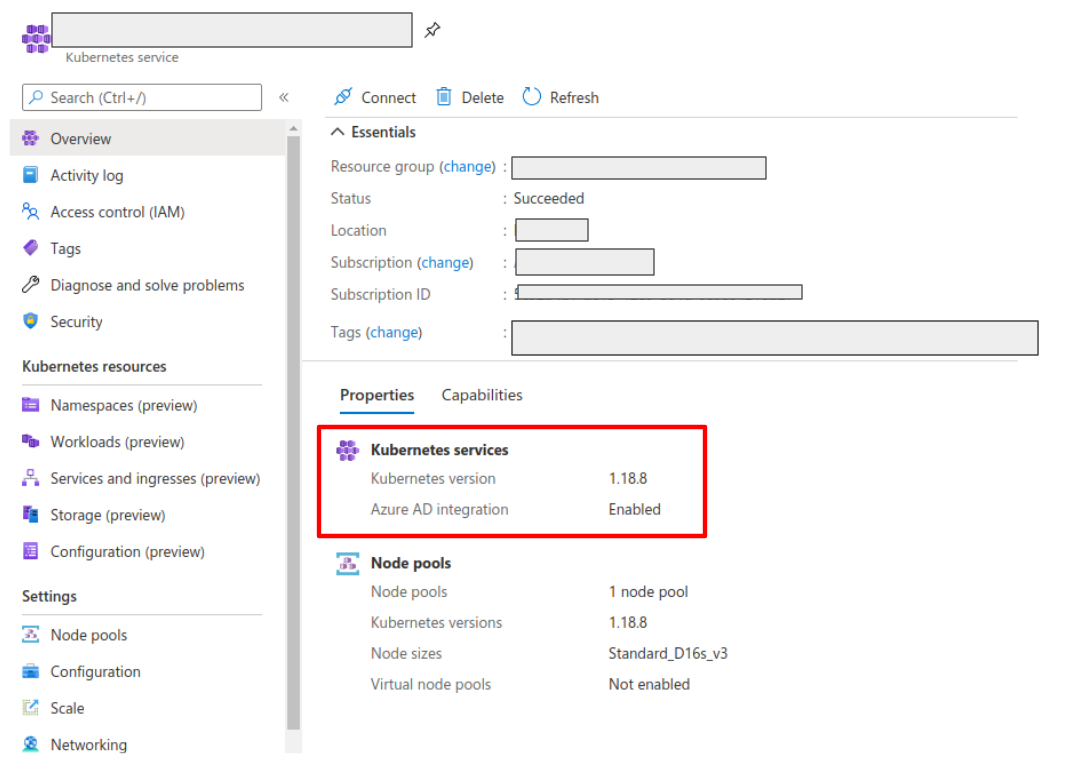
Create a web application for Kiali in your Azure AD panel:
- Go to AAD > App Registration, create an application with a redirect url like
https://<your-kiali-url>/kiali
- Go to Certificates & secrets and create a client secret.
- After creating the client secret, take note of the provided secret. Create a
Kubernetes secret in your cluster as mentioned in the Set-up
with namespace access control support section. Please, note that the suggested name for the
Kubernetes Secret is
kiali. If you want to customize the secret name, you
will have to specify your custom name in the Kiali CR. See: secret_name in Kial CR Reference.
- Go to API Permissions and press the Add a permission button. In the new page that appears, switch to the
APIs my organization uses tab.
- Type the following ID in the search field:
6dae42f8-4368-4678-94ff-3960e28e3630 (this is a shared ID for all Azure
clusters). And select the resulting entry.
- Select the Delegated permissions square.
- Select the
user.read permission.
- Go to Authentication and make sure that the Access tokens checkbox is ticked.

Then, create or modify your Kiali CR and include the following settings:
spec:
  auth:
    strategy: "openid"
    openid:
      client_id: "<your Kiali application client id from Azure>"
      issuer_uri: "https://sts.windows.net/<your AAD tenant id>/"
      username_claim: preferred_username
      api_token: access_token
      additional_request_params:
        resource: "6dae42f8-4368-4678-94ff-3960e28e3630"
You can find your client_id and tenant_id in the Overview page of the Kiali
App registration that you just created. See this documentation for more information.
1.4 - OpenShift strategy
Access Kiali requiring OpenShift authentication.
Introduction
The openshift authentication strategy is the preferred and default strategy
when Kiali is deployed on an OpenShift cluster.
When using the openshift strategy, a user logging into Kiali will be
redirected to the login page of the OpenShift console. Once the user provides
his OpenShift credentials, he will be redireted back to Kiali and will be
logged in if the user has enough privileges.
The openshift strategy supports namespace access control.
The openshift strategy is supported for single and multi-cluster deployments.
Set-up
Since openshift is the default strategy when deploying Kiali in OpenShift,
you shouldn’t need to configure anything. If you want to be verbose, use the
following configuration in the Kiali CR:
spec:
  auth:
    strategy: openshift
The Kiali operator will make sure to setup the needed OpenShift OAuth resources to register
Kiali as a client for the most common use-cases. The openshift strategy does have a few
configuration settings that most people will never need but are available in case you have
a situation where the customization is needed. See the Kiali CR Reference page for the
documentation on those settings.
Multi-Cluster
There are some things to know when using the openshift strategy with Kiali in a multi-cluster environment.
Consistent Kiali Namespace and Instance-Name
The default namespace for Kiali is istio-system. But many users prefer to use a dedicated namespace for Kiali, such as kiali, kiali-server, etc. In a multi-cluster environment Kiali must be deployed in the same namespace on each cluster. Clusters that don’t have a Kiali deployment must still provide the namespace, to hold the remote cluster resources.
The default instance-name for kiali is kiali. Any change to the default must also be made consistently across all clusters.
Assuming Kiali is installed via the Kiali Operator. Any customization would be done via the following CR settings:
spec.deployment.namespacespec.deployment.instance_name
It is recommended that the Kiali Operator be deployed on all clusters, even if Kiali itself is not deployed. This will ensure that the proper namespace and remote cluster resources are created. For clusters without Kiali, requiring only the remote cluster resources (for auth), configure the CR with:
spec.deployment.remote_cluster_resources_only: true
OpenShift OAuthClient Naming
OpenShift OAuth requires an OAuthClient resource on each cluster to be named <instance-name>-<namespace>. For example, if Kiali is installed with the default instance name kiali in namespace istio-system, the OAuthClient on every cluster must be named kiali-istio-system.
Both the Kiali Operator and the Kiali Server helm chart automatically create the OAuthClient with the correct name when they create the remote cluster resources. The kiali-prepare-remote-cluster.sh script also delegates to the Kiali Server helm chart for resource creation and will produce a correctly-named OAuthClient, provided you pass --kiali-resource-name and --remote-cluster-namespace values that match the Kiali instance name and namespace on the cluster where Kiali is deployed. If you are managing resources entirely manually, ensure the OAuthClient on the remote cluster is named consistently with the Kiali instance name and namespace.
If the OAuthClient names do not match across clusters, OAuth authentication will fail.
OAuthClient Redirect URIs for Remote Cluster Resources
When using remote_cluster_resources_only: true on a remote cluster with the openshift auth strategy, the Kiali Operator must create an OAuthClient resource but cannot automatically determine the redirect URI (since there is no Kiali server or route on the remote cluster). You must explicitly specify the redirect URI in the Kiali CR on the remote cluster via spec.auth.openshift.redirect_uris. Without this, the Kiali Operator will fail to reconcile with the error:
Redirect URIs for the Kiali Server OAuthClient are not specified via auth.openshift.redirect_uris;
this is required when creating remote cluster resources with auth.strategy of openshift.
The redirect URI must point back to the Kiali server on the cluster where Kiali is deployed. Critically, the URI must include the remote cluster’s name as a path suffix in the form https://<kiali-route-host>/api/auth/callback/<remote-cluster-name>. This is required so that the OAuth callback can correctly identify which cluster the login is for. Using the base /api/auth/callback path (without the cluster name) will result in the login failing with a http: named cookie not present error.
To determine the correct URI:
- If Kiali is already deployed, run this on the cluster where Kiali is deployed:
oc get route -l app.kubernetes.io/name=kiali -n <kiali-namespace> -o jsonpath='{..spec.host}'
- If Kiali is not yet deployed, you can predict the route hostname from the cluster’s app domain by running this on the cluster where Kiali will be deployed:
oc get ingresses.config.openshift.io cluster -o jsonpath='{.spec.domain}'
The Kiali route hostname will be something like kiali-<namespace>.<app-domain>, so the full redirect URI will be something like https://kiali-<namespace>.<app-domain>/api/auth/callback/<remote-cluster-name>, where <remote-cluster-name> is the Istio cluster name of the remote cluster.
For example, if Kiali is deployed in namespace istio-system with instance_name kiali, the app domain is apps.east.example.com, and the remote cluster’s Istio cluster name is west, the Kiali CR on the remote cluster should include:
spec:
  auth:
    openshift:
      redirect_uris:
        - https://kiali-istio-system.apps.east.example.com/api/auth/callback/west
  deployment:
    remote_cluster_resources_only: true
User Login Flow for Multi-Cluster
When using the openshift strategy with multiple clusters, users must be logged into each cluster in order to access resources on that cluster. The Kiali UI provides a mechanism to log into remote clusters:
- In your browser, navigate to the Kiali UI and log in using your credentials for the cluster where Kiali is deployed.
- Once logged in, use the user profile dropdown in the Kiali UI to initiate login to each remote cluster. Kiali will redirect you to the remote cluster’s OpenShift login page.
- Log in with your credentials for that remote cluster. You will be redirected back to the Kiali UI. Repeat step 2 for each additional remote cluster until you are logged into all clusters.
Currently, OpenShift OAuth does not provide SSO across clusters. Each cluster requires its own login. If you are having trouble logging into a remote cluster from within Kiali, try starting a fresh private/incognito browser tab to ensure there are no stale OAuth cookies from prior logins to the remote cluster’s OpenShift console.
Using an internal or self-signed certificate
If you have a multi-cluster Kiali deployment and the OAuth server is configured with an external IdP that uses an internal or self-signed certificate, you can configure Kiali to trust the server’s certificate by creating a ConfigMap named kiali-oauth-cabundle containing the CA certificate bundle for the server under the oauth-server-ca.crt key:
Note that if you are deploying Kiali with spec.deployment.instance_name set to a value that is different than the default of kiali, your ConfigMap name needs to be that instance name appended with “-oauth-bundle”. For example, if your instance name is “myserver” then the name of the ConfigMap must be myserver-oauth-cabundle.
apiVersion: v1
kind: ConfigMap
metadata:
  name: kiali-oauth-cabundle
  namespace: istio-system # This is Kiali's install namespace
data:
  oauth-server-ca.crt: <PEM encoded CA root certificate>
Kiali will automatically trust this root certificate for all HTTPS requests (not just OAuth). The certificate is loaded into Kiali’s global certificate pool. Kiali watches for changes to the CA bundle and automatically refreshes without requiring a pod restart. If you have multiple different CAs, for different clusters, include each as a separate block in the bundle.
For most use cases, you can simply add your CA to the kiali-cabundle ConfigMap under the additional-ca-bundle.pem key instead of creating a separate kiali-oauth-cabundle ConfigMap. Both approaches result in the CA being trusted globally.
Insecure setting
You should only use this setting for testing and not in a production environment.
You can disable certificate validation between Kiali and the remote OAuth server(s) by setting insecure_skip_verify_tls to true in
the Kiali CR:
spec:
  auth:
    openshift:
      insecure_skip_verify_tls: true
1.5 - Token strategy
Access Kiali requiring a Kubernetes ServiceAccount token.
Introduction
The token authentication strategy allows a user to login to Kiali using the
token of a Kubernetes ServiceAccount. This is similar to the
login view of Kubernetes Dashboard.
The token strategy supports namespace access control.
The token strategy is only supported for single cluster.
Set-up
Since token is the default strategy when deploying Kiali in Kubernetes, you
shouldn’t need to configure anything, unless your cluster is OpenShift. If you
want to be verbose or if you need to enable the token strategy in OpenShift,
use the following configuration in the Kiali CR:
spec:
  auth:
    strategy: token
The token strategy doesn’t have any additional configuration other than the
session expiration time.
1.6 - Session options
Session timeout and signing key configuration
There are two settings that are available for the user’s session. The first one
is the session expiration time, which is only applicable to
token and header
authentication strategies:
spec:
  login_token:
    # By default, users session expires in 24 hours.
    expiration_seconds: 86400
The session expiration time is the amount of time before the user is asked to
extend his session by another cycle. It does not matter if the user is actively
using Kiali, the user will be asked if the session should be extended.
The second available option is the signing key configuration, which is unset by
default, meaning that a random 16-character signing key will be generated
and stored to a secret named kiali-signing-key, in Kiali’s installation
namespace:
spec:
  login_token:
    # By default, create a random signing key and store it in
    # a secret named "kiali-signing-key".
    signing_key: ""
If the secret already exists (which may mean a previous Kiali installation was
present), then the secret is reused.
The signing key is used on security sensitive data. For example, one of the
usages is to sign HTTP cookies related to the user session to prevent session
forgery.
If you need to set a custom fixed key, you can pre-create or modify the
kiali-signing-key secret:
apiVersion: v1
kind: Secret
metadata:
  namespace: "kiali-installation-namespace"
  name: kiali-signing-key
type: Opaque
data:
  key: "<your signing key encoded in base64>"
The signing key must be 16, 24 or 32 bytes length. Otherwise, Kiali will fail to start.
If you prefer a different secret name for the signing key and/or a different
key-value pair of the secret, you can specify your preferred names in the Kiali
CR:
spec:
  login_token:
    signing_key: "secret:<secretName>:<secretDataKey>"
It is possible to specify the signing key directly in the Kiali CR, in the
spec.login_token.signing_key attribute. However, this should be only for
testing purposes. The signing key is sensitive and should be treated like a
password that must be protected.
2 - Console Customization
Default selections, find and hide presets and custom metric aggregations.
Custom metric aggregations
The inbound and outbound metric pages, in the Metrics settings drop-down,
provides an opinionated set of groupings that work both for filtering out
metric data that does not match the selection and for aggregating data into
series. Each option is backed by a label on the collected Istio telemetry.
It is possible to add custom aggregations, like in the following example:
spec:
  kiali_feature_flags:
    ui_defaults:
      metrics_inbound:
        aggregations:
        - display_name: Istio Network
          label: topology_istio_io_network
        - display_name: Istio Revision
          label: istio_io_rev
      metrics_outbound:
        aggregations:
        - display_name: Istio Revision
          label: istio_io_rev
Notice that custom aggregations for inbound and outbound metrics are defined separately.
You can find some screenshots in Kiali v1.40 feature update blog
post.
Default metrics duration and refresh interval
Most Kiali pages show metrics per refresh and refresh interval
drop-downs. These are located at the top-right of the page.
Metrics per refresh specifies the time range back from the current
instant to fetch metrics and/or distributed tracing data. Also known as the query duration.
By default, a 1-minute time range is selected, or the lowest valid setting.
Refresh interval specifies how often Kiali will automatically refresh the
data shown. By default, Kiali refreshes data every 60 seconds.
spec:
  kiali_feature_flags:
    ui_defaults:
      # Valid values: 1m, 2m, 5m, 10m, 30m, 1h, 3h, 6h, 12h, 1d, 7d, 30d
      metrics_per_refresh: "1m"

      # Valid values: pause, manual, 10s, 15s, 30s, 1m, 5m, 15m
      refresh_interval: "15s"
User selections won’t persist a reload.
Default namespace selection
By default, when Kiali is accessed by the first time, on most Kiali pages users
will need to use the namespace drop-down to choose namespaces they want to view
data from. The selection will be persisted on reloads.
However, it is possible to configure a predefined selection of
namespaces, like in the following example:
spec:
  kiali_feature_flags:
    ui_defaults:
      namespaces:
      - istio-system
      - bookinfo
Namespace selection will reset to the predefined set on reloads. Also, if for
some reason a namespace becomes deleted, Kiali will simply ignore it from the
list.
Graph find and hide presets
In the toolbar of the topology graph, the Find and Hide textboxes can be
configured with presets for your most used criteria. You can find screenshots
and a brief description of this feature in the feature update blog post for
versions 1.31 to 1.33.
The following are the default presets:
spec:
  kiali_feature_flags:
    ui_defaults:
      graph:
        find_options:
        - auto_select: false
          description: "Find: slow edges (> 1s)"
          expression: "rt > 1000"
        - auto_select: false
          description: "Find: unhealthy nodes"
          expression:  "! healthy"
        - auto_select: false
          description: "Find: unknown nodes"
          expression:  "name = unknown"
        hide_options:
        - auto_select: false
          description: "Hide: healthy nodes"
          expression: "healthy"
        - auto_select: false
          description: "Hide: unknown nodes"
          expression:  "name = unknown"
Hopefully, the attributes to configure this feature are self-explanatory.
To enable one of the configurations by default, it is possible to set auto_select to true, available for find and hide settings.
Note that by providing your own presets, you will be overriding the default
configuration. Make sure to include any default presets that you need in case
you provide your own configuration.
Graph default traffic rates
Traffic rates in the graph are fetched from Istio telemetry and there are
several metric sources
that can be used.
In the graph page, you can select the traffic rate metrics using the Traffic
drop-down (next to the Namespaces drop-down). By default, Requests is
selected for GRPC and HTTP protocols, and Sent bytes is selected for the TCP
protocol, but you can change the default selection:
spec:
  kiali_feature_flags:
    ui_defaults:
      graph:
        traffic:
          grpc: "requests" # Valid values: none, requests, sent, received and total
          http: "requests" # Valid values: none and requests
          tcp:  "sent"     # Valid values: none, sent, received and total
Note that only requests provide response codes and will allow health to be
calculated. Also, the resulting topology graph may be different for each source.
3 - Custom Dashboards
Configuring additional, non-default dashboards.
Custom Dashboards require some configuration to work properly.
Declaring a custom dashboard
When installing Kiali, you define your own custom dashboards in the Kiali CR spec.custom_dashboards field. Here’s an example of what it looks like:
custom_dashboards:
- name: vertx-custom
  title: Vert.x Metrics
  runtime: Vert.x
  discoverOn: "vertx_http_server_connections"
  items:
  - chart:
      name: "Server response time"
      unit: "seconds"
      spans: 6
      metrics:
      - metricName: "vertx_http_server_responseTime_seconds"
        displayName: "Server response time"
      dataType: "histogram"
      aggregations:
      - label: "path"
        displayName: "Path"
      - label: "method"
        displayName: "Method"
  - chart:
      name: "Server active connections"
      unit: ""
      spans: 6
      metricName: "vertx_http_server_connections"
      dataType: "raw"
  - include: "micrometer-1.1-jvm"
  externalLinks:
  - name: "My custom Grafana dashboard"
    type: "grafana"
    variables:
      app: var-app
      namespace: var-namespace
      version: var-version
The name field corresponds to what you can set in the pod annotation kiali.io/dashboards.
The rest of the field definitions are:
- runtime: optional, name of the related runtime. It will be displayed on the corresponding Workload Details page. If omitted no name is displayed.
- title: dashboard title, displayed as a tab in Application or Workloads Details
- discoverOn: metric name to match for auto-discovery. If omitted, the dashboard won’t be discovered automatically, but can still be used via pods annotation.
- items: a list of items, that can be either chart, to define a new chart, or include to reference another dashboard
- chart: new chart object
- name: name of the chart
- chartType: type of the chart, can be one of line (default), area, bar or scatter
- unit: unit for Y-axis. Free-text field to provide any unit suffix. It can eventually be scaled on display. See specific section below.
- unitScale: in case the unit needs to be scaled by some factor, set that factor here. For instance, if your data is in milliseconds, set
0.001 as scale and seconds as unit.
- spans: number of “spans” taken by the chart, from 1 to 12, using bootstrap convention
- metrics: a list of metrics to display on this single chart:
- metricName: the metric name in Prometheus
- displayName: name to display on chart
- dataType: type of data to be displayed in the chart. Can be one of raw, rate or histogram. Raw data will be queried without transformation. Rate data will be queried using
promQL rate() function. And histogram with histogram_quantile() function.
- min and max: domain for Y-values. When unset, charts implementations should usually automatically adapt the domain with the displayed data.
- xAxis: type of the X-axis, can be one of time (default) or series. When set to series, only one datapoint per series will be displayed, and the chart type then defaults to bar.
- aggregator: defines how the time-series are aggregated when several are returned for a given metric and label set. For example, if a Deployment creates a ReplicaSet of several Pods, you will have at least one time-series per Pod. Since Kiali shows the dashboards at the workload (ReplicaSet) level or at the application level, they will have to be aggregated. This field can be used to fix the aggregator, with values such as sum or avg (full list available in Prometheus documentation). However, if omitted the aggregator will default to sum and can be changed from the dashboard UI.
- aggregations: list of labels eligible for aggregations / groupings (they will be displayed in Kiali through a dropdown list)
- label: Prometheus label name
- displayName: name to display in Kiali
- singleSelection: boolean flag to switch between single-selection and multi-selection modes on the values of this label. Defaults to false.
- groupLabels: a list of Prometheus labels to be used for grouping. Similar to aggregations, except this grouping will be always turned on.
- sortLabel: Prometheus label to be used for the metrics display order.
- sortLabelParseAs: set to int if sortLabel needs to be parsed and compared as an integer instead of string.
- include: to include another dashboard, or a specific chart from another dashboard. Typically used to compose with generic dashboards such as the ones about MicroProfile Metrics or Micrometer-based JVM metrics. To reference a full dashboard, set the name of that dashboard. To reference a specific chart of another dashboard, set the name of the dashboard followed by
$ and the name of the chart (ex: include: "microprofile-1.1$Thread count").
- externalLinks: a list of related external links (e.g. to Grafana dashboards)
- name: name of the related dashboard in the external system (e.g. name of a Grafana dashboard)
- type: link type, currently only grafana is allowed
- variables: a set of variables that can be injected in the URL. For instance, with something like namespace: var-namespace and app: var-app, an URL to a Grafana dashboard that manages namespace and app variables would look like:
http://grafana-server:3000/d/xyz/my-grafana-dashboard?var-namespace=some-namespace&var-app=some-app. The available variables in this context are namespace, app and version.
Label clash: you should try to avoid labels clashes within a dashboard.
In Kiali, labels for grouping are aggregated in the top toolbar, so if the same label refers to different things depending on the metric, you wouldn’t be able to distinguish them in the UI. For that reason, ideally, labels should not have too generic names in Prometheus.
For instance labels named “id” for both memory spaces and buffer pools would better be named “space_id” and “pool_id”. If you have control on label names, it’s an important aspect to take into consideration.
Else, it is up to you to organize dashboards with that in mind, eventually splitting them into smaller ones to resolve clashes.
Modifying Built-in Dashboards: If you want to modify or remove a built-in dashboard, you can set its new definition in the Kiali CR’s spec.custom_dashboards. Simply define a custom dashboard with the same name as the built-in dashboard. To remove a built-in dashboard so Kiali doesn’t use it, simply define a custom dashboard by defining only its name with no other data associated with it (e.g. in spec.custom_dashboards you add a list item that has - name: <name of built-in dashboard to remove>.
Dashboard scope
The custom dashboards defined in the Kiali CR are available for all workloads in all namespaces.
Additionally, new custom dashboards can be created for a given namespace or workload, using the dashboards.kiali.io/templates annotation.
This is an example where a “Custom Envoy” dashboard will be available for all applications and workloads for the default namespace:
apiVersion: v1
kind: Namespace
metadata:
  name: default
  annotations:
    dashboards.kiali.io/templates: |
      - name: custom_envoy
        title: Custom Envoy
        discoverOn: "envoy_server_uptime"
        items:
          - chart:
              name: "Pods uptime"
              spans: 12
              metricName: "envoy_server_uptime"
              dataType: "raw"
This other example will create an additional “Active Listeners” dashboard only on details-v1 workload:
apiVersion: apps/v1
kind: Deployment
metadata:
  name: details-v1
  labels:
    app: details
    version: v1
spec:
  replicas: 1
  selector:
    matchLabels:
      app: details
      version: v1
  template:
    metadata:
      labels:
        app: details
        version: v1
      annotations:
        dashboards.kiali.io/templates: |
          - name: envoy_listeners
            title: Active Listeners
            discoverOn: "envoy_listener_manager_total_listeners_active"
            items:
              - chart:
                  name: "Total Listeners"
                  spans: 12
                  metricName: "envoy_listener_manager_total_listeners_active"
                  dataType: "raw"
    spec:
      serviceAccountName: bookinfo-details
      containers:
      - name: details
        image: docker.io/istio/examples-bookinfo-details-v1:1.16.2
        imagePullPolicy: IfNotPresent
        ports:
        - containerPort: 9080
        securityContext:
          runAsUser: 1000
Units
Some units are recognized in Kiali and scaled appropriately when displayed on charts:
unit: "seconds" can be scaled down to ms, µs, etc.unit: "bytes-si" and unit: "bitrate-si" can be scaled up to kB, MB (etc.) using SI / metric system. The aliases unit: "bytes" and unit: "bitrate" can be used instead.unit: "bytes-iec" and unit: "bitrate-iec" can be scaled up to KiB, MiB (etc.) using IEC standard / IEEE 1541-2002 (scale by powers of 2).
Other units will fall into the default case and be scaled using SI standard. For instance, unit: "m" for meter can be scaled up to km.
Prometheus Configuration
Kiali custom dashboards work exclusively with Prometheus, so it must be configured correctly to pull your application metrics.
If you are using the demo Istio installation with addons, your Prometheus instance should already be correctly configured and you can skip to the next section; with the exception of Istio 1.6.x where
you need customize the ConfigMap, or install Istio with the flag --set meshConfig.enablePrometheusMerge=true.
Using another Prometheus instance
You can use a different instance of Prometheus for these metrics, as opposed to Istio metrics. This second Prometheus instance can be configured from the Kiali CR when using the Kiali operator, or ConfigMap otherwise:
# ...
external_services:
  custom_dashboards:
    prometheus:
      url: URL_TO_PROMETHEUS_SERVER_FOR_CUSTOM_DASHBOARDS
    namespace_label: kubernetes_namespace
  prometheus:
    url: URL_TO_PROMETHEUS_SERVER_FOR_ISTIO_METRICS
# ...
For more details on this configuration, such as Prometheus authentication options, check the Kiali CR Reference page.
You must make sure that this Prometheus instance is correctly configured to scrape your application pods and generates labels that Kiali will understand. Please refer to
this documentation to setup the kubernetes_sd_config section. As a reference,
here is how it is configured in Istio.
It is important to preserve label mapping, so that Kiali can filter by app and version, and to have the same namespace label as defined per Kiali config. Here’s a relabel_configs that allows this:
      relabel_configs:
      - action: labelmap
        regex: __meta_kubernetes_pod_label_(.+)
      - source_labels: [__meta_kubernetes_namespace]
        action: replace
        target_label: kubernetes_namespace
Pod Annotations and Auto-discovery
Application pods must be annotated for the Prometheus scraper, for example, within a Deployment definition:
spec:
  template:
    metadata:
      annotations:
        prometheus.io/scrape: "true"
        prometheus.io/port: "8080"
        prometheus.io/path: "/metrics"
- prometheus.io/scrape tells Prometheus to fetch these metrics or not
- prometheus.io/port is the port under which metrics are exposed
- prometheus.io/path is the endpoint path where metrics are exposed, default is /metrics
Kiali will try to discover automatically dashboards that are relevant for a given Application or Workload. To do so, it reads their metrics and try to match them with the discoverOn field defined on dashboards.
But if you can’t rely on automatic discovery, you can explicitly annotate the pods to associate them with Kiali dashboards.
spec:
  template:
    metadata:
      annotations:
        # (prometheus annotations...)
        kiali.io/dashboards: vertx-server
kiali.io/dashboards is a comma-separated list of dashboard names that Kiali will look for. Each name in the list must match the name of a built-in dashboard or the name of a custom dashboard as defined in the Kial CR’s spec.custom_dashboards.
4 - Debugging Kiali
How to debug the Kiali Server and the Kiali Operator using logs, metrics, traces, and profiler.
Logs
The most basic way of debugging the internals of Kiali is to examine its log messages. A typical way of examining the log messages is via:
kubectl logs -n istio-system deployment/kiali
Each log message is logged at a specific level. The different log levels are trace, debug, info, warn, error, and fatal. By default, log messages at info level and higher will be logged. If you want to see more verbose logs, set the log level to debug or trace (trace is the most verbose setting and will make the log output very “noisy”). You set the log level in the Kiali CR:
spec:
  deployment:
    logger:
      log_level: debug
By default, Kiali will log messages in a basic text format. You can have Kiali log messages in JSON format, which can sometimes make reading, querying, and filtering the logs easier:
spec:
  deployment:
    logger:
      log_format: json
Filtering logs
You may want to pinpoint specific log messages in the Kiali logs. The following are different commands and expressions you can use in order to filter the logs to help expose messages you are most interested in. There are two sets of commands/expressions documented below: one using grep and sed if Kiali is logging its messages in simple text format, and the other using jq if Kiali is logging its messages in JSON format. (Note that jq will format each JSON message into multiple lines to read the JSON easier. Pass the -c option to jq to condense the JSON into one line per log message - it may be harder to read, but will reduce the amount of lines considerably.)
Note that all commands/expressions below should have the Kiali logs piped into its stdin. Usually this means using kubectl to get the logs from Kiali and pipe them, like this:
kubectl logs -n istio-system deployments/kiali | <...commands/expressions here...>
Remove log levels
If you have enabled the log level of “trace”, the Kiali logs will contain a large amount of messages. If you have a hard time sifting through all of those messages, rather than reconfigure Kiali with a different log level you can simply filter out the trace messages.
|
|
| text: |
grep -v ' TRC ' |
| json: |
jq -R 'fromjson? | select(.level != "trace")' |
If you want to remove both “trace” and “debug” level messages (leaving “info” and higher priority messages):
|
|
| text: |
grep -vE ' (TRC|DBG) ' |
| json: |
jq -R 'fromjson? | select(.level != "trace" and .level != "debug")' |
Show logs for only a single request
Some log messages are associated with a single, specific request. You can obtain all the logs associated with any specific request given a request ID. To determine which request ID you want to use as a filter, you first find all the request IDs in the logs:
|
|
| text: |
grep -o 'request-id=[^ ]*' | sed 's/^request-id=//' | sort -u |
| json: |
jq -rR 'fromjson? | select(has("request-id")) | ."request-id"' |
Pick a request ID, and use it to retrieve all the logs associated with that request:
|
|
| text: |
grep 'request-id=abc123' |
| json: |
jq -rR 'fromjson? | select(."request-id" == "abc123")' |
But just having a list of every request ID is likely not enough. You most likely want to look at the logs for requests for a specific Kiali API (like the graph generation API). To see all the different routes into the Kiali API server that were requested, you can get their route names like this:
|
|
| text: |
grep -o 'route=[^ ]*' | sed 's/^route=//' | sort -u |
| json: |
jq -rR 'fromjson? | select(.route) | .route' | sort -u |
The GraphNamespaces route is an important one - it is the API that is used to generate the main Kiali graphs. If you want to see all the IDs for all requests to this API, you can do this:
|
|
| text: |
grep 'route=GraphNamespaces' | grep -o 'request-id=[^ ]*' | sed 's/^request-id=//' | sort -u |
| json: |
jq -rR 'fromjson? | select(.route == "GraphNamespaces") | .["request-id"]' | sort -u |
Now you can take one of those request IDs and obtain logs for it (as explained earlier) to see all the logs for that request to generate a graph.
Some routes that may be of interest are:
AggregateMetrics: aggregate metrics for a given resourceAppMetrics, ServiceMetrics, WorkloadMetrics: gets metrics for a given resourceAppSpans, ServiceSpans, WorkloadSpans: gets tracing spans for a given resourceAppTraces, ServiceTraces, WorkloadTraces: gets traces for a given resourceAuthenticate: authenticates usersClustersHealth: gets the health data for all resources in a namespace within a single clusterConfigValidationSummary: gets the validation summary for all resources in given namespacesControlPlaneMetrics: gets metrics for a single control planeGraphAggregate: generates a node detail graphGraphNamespaces: generates a namespaces graphIstioConfigDetails: gets the content of an Istio configuration resourceIstioConfigList: gets the list of Istio configuration resources in a namespaceMeshGraph: generates a mesh graphNamespaceList: gets the list of available namespacesNamespaceMetrics: gets metrics for a single namespaceNamespaceValidationSummary: gets the validation summary for all resources in a given namespaceTracesDetails: gets detailed information on a specific trace
Show logs of processing times
Kiali collects metrics of its internal systems to track its performance (see the next section, “Metrics”). Many of these metrics use a timer to measure the duration of time that Kiali takes to process some unit of work (for example, the time it takes to generate a graph). Kiali will log these duration times as well as export them to Prometheus. To see what metric timers Kiali is tracking internally, you can do this:
|
|
| text: |
grep -o 'timer=[^ ]*' | sed 's/^timer=//' | sort -u |
| json: |
jq -rR 'fromjson? | select(.timer) | .timer' | sort -u |
Note that Kiali will not log times that are under 3 seconds since those are deemed uninteresting and logging them will make the logs “noisy”. Prometheus will still collect those metrics, so they are still being recorded.
One timer is especially useful - the timer named “GraphGenerationTime”. You can query the log for all the graph generation times like this:
|
|
| text: |
grep 'timer=GraphGenerationTime' |
| json: |
jq -R 'fromjson? | select(.timer == "GraphGenerationTime")' |
Each log message contains a duration attribute - this is the amount of time it took to generate the graph (or parts of the graph). Look at the additional attributes for details on what the timer measured.
Some timers that may be of interest are:
APIProcessingTime: The time it takes to process an API request in its entiretyCheckerProcessingTime: The time it takes to run a specific validation checkerGraphAppenderTime: The time it takes for an appender to decorate a graphGraphGenerationTime: The time it takes to generate a full graphPrometheusProcessingTime: The time it takes to run Prometheus queriesSingleValidationProcessingTime: The time it takes to validate an Istio configuration resourceTracingProcessingTime: The time it takes to run Tracing queriesValidationProcessingTime: The time it takes to validate a set of Istio configuration resources
Metrics
Kiali has a metrics endpoint that can be enabled, allowing Prometheus to collect Kiali metrics. You can then use Prometheus (or Kiali itself) to examine and analyze these metrics.
The metrics server uses the same TLS configuration as the main Kiali server. When TLS is enabled (via identity.cert_file and identity.private_key_file), the metrics endpoint requires HTTPS and enforces the same TLS policy (versions and cipher suites). When TLS is not configured, the metrics endpoint uses plain HTTP.
Configuring Prometheus to Scrape Kiali Metrics
When Kiali’s metrics endpoint is enabled, the Kiali pod includes standard prometheus.io/* annotations that many Prometheus deployments use for auto-discovery:
prometheus.io/scrape: "true"prometheus.io/port: "<metrics-port>" (default: 9090)prometheus.io/scheme: "http" or "https" (depending on TLS configuration)
For HTTP (no TLS configured): If your Prometheus setup is configured to honor prometheus.io/* pod annotations (for example, the standard kubernetes-pods scrape job), it can scrape Kiali metrics without additional configuration. If you’re using Prometheus Operator and do not have a pod-annotation scrape job, create a PodMonitor or ServiceMonitor instead.
For HTTPS (TLS configured): When TLS is enabled, Prometheus needs additional configuration to properly scrape the metrics endpoint. This is particularly relevant on OpenShift where Kiali automatically uses service-serving certificates.
The challenge is that service-serving certificates are valid for the Service DNS name (e.g., kiali.istio-system.svc), not for pod IP addresses. When Prometheus scrapes pods directly by IP address (as the standard kubernetes-pods job does), TLS certificate validation fails. The solutions below address this by ensuring Prometheus uses the Service DNS name for TLS validation, even when the actual scrape target is a pod IP.
Option 1: ServiceMonitor (Prometheus Operator)
If you’re using the Prometheus Operator, create a ServiceMonitor that scrapes through the Kiali Service (where the certificate is valid):
apiVersion: monitoring.coreos.com/v1
kind: ServiceMonitor
metadata:
  name: kiali
  namespace: istio-system  # Or your Kiali namespace
spec:
  endpoints:
  - port: tcp-metrics
    scheme: https
    tlsConfig:
      # For OpenShift cluster monitoring, the service CA is available at this path
      caFile: /etc/prometheus/configmaps/serving-certs-ca-bundle/service-ca.crt
      # serverName must match the certificate's SAN
      serverName: kiali.istio-system.svc
  namespaceSelector:
    matchNames:
    - istio-system  # Or your Kiali namespace
  selector:
    matchLabels:
      app.kubernetes.io/name: kiali
CA File Path Note
The caFile path shown above (/etc/prometheus/configmaps/serving-certs-ca-bundle/service-ca.crt) is specific to OpenShift’s built-in cluster monitoring Prometheus. If you’re using a different Prometheus deployment, you’ll need to:
- Mount the OpenShift service CA into your Prometheus pod
- Adjust the
caFile path accordingly
To get the service CA, create a ConfigMap with the annotation service.beta.openshift.io/inject-cabundle: "true" and OpenShift will automatically populate it with the service CA certificate.
Option 2: Static Scrape Configuration
For non-Operator Prometheus deployments, add a scrape job to your Prometheus configuration file (prometheus.yml) that targets the Kiali Service:
scrape_configs:
- job_name: 'kiali'
  scheme: https
  tls_config:
    ca_file: /path/to/service-ca.crt
    server_name: kiali.istio-system.svc
  static_configs:
  - targets:
    - kiali.istio-system.svc:9090
Option 3: Skip Certificate Verification (Not Recommended)
For testing purposes only, you can configure Prometheus to skip certificate verification. In a ServiceMonitor resource, add insecureSkipVerify to the tlsConfig:
tlsConfig:
  insecureSkipVerify: true
Or in your Prometheus configuration file (prometheus.yml), add insecure_skip_verify to the tls_config:
tls_config:
  insecure_skip_verify: true
Security Warning: Skipping certificate verification defeats the purpose of TLS and makes your metrics collection vulnerable to man-in-the-middle attacks. Only use this for testing, never in production.
Viewing and Analyzing Kiali Metrics
To see the metrics that are currently being emitted by Kiali, you can run the following command which simply parses the metrics endpoint data and outputs all the metrics it finds:
# For HTTP (when TLS not configured):
curl -s http://<KIALI_HOSTNAME>:9090/metrics | grep -o '^# HELP kiali_.*' | awk '{print $3}'

# For HTTPS (when TLS configured):
curl -s -k https://<KIALI_HOSTNAME>:9090/metrics | grep -o '^# HELP kiali_.*' | awk '{print $3}'
The Kiali UI itself graphs some of these metrics. In the Kiali UI, navigate to the Kiali workload and select the “Kiali Internal Metrics” tab:
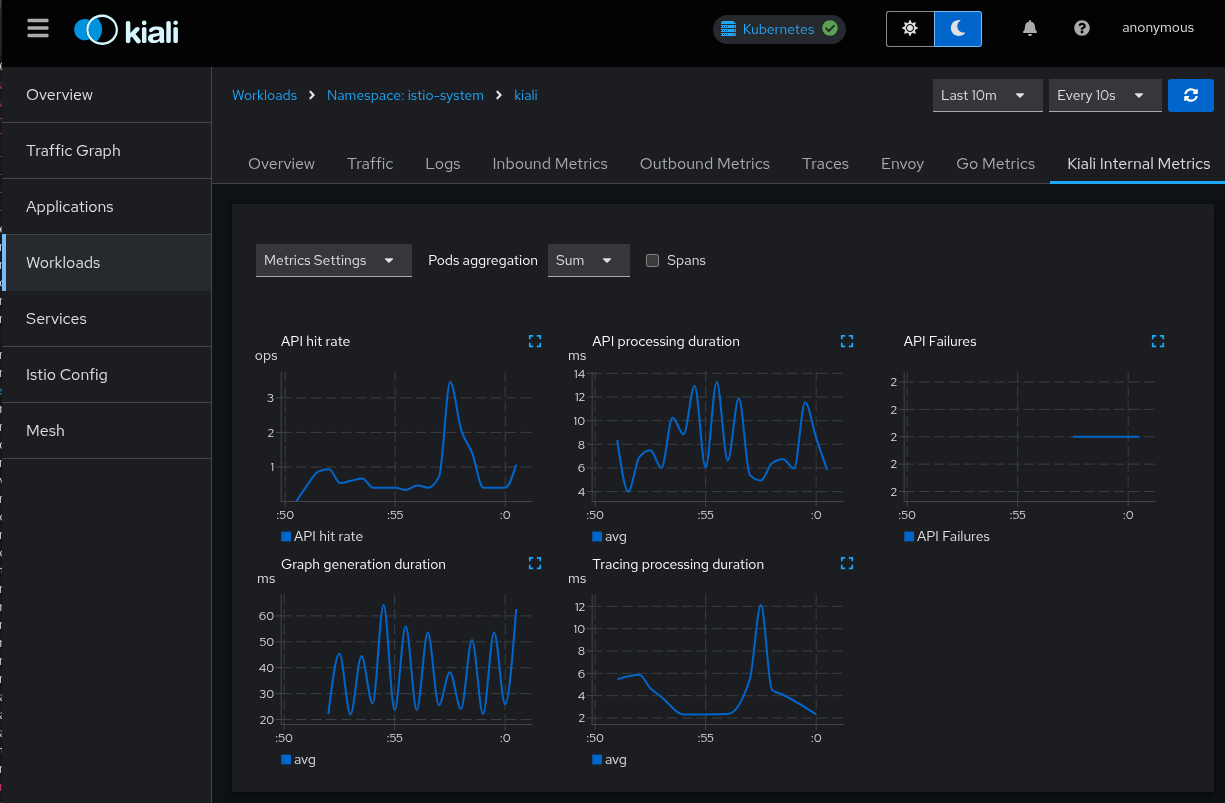
Use the Kiali UI to analyze these metrics in the same way that you would analyze your application metrics. (Note that “Tracing processing duration” will be empty if you have not integrated your Tracing backend with Kiali).
Because these are metrics collected by Promtheus, you can analyze Kiali’s metrics through Prometheus queries and the Prometheus UI. Some of the more interesting Prometheus queries are listed below.
- API routes
- Average latency per API route:
rate(kiali_api_processing_duration_seconds_sum[5m]) / rate(kiali_api_processing_duration_seconds_count[5m])
- Request rate per API route:
rate(kiali_api_processing_duration_seconds_count[5m])
- 95th percentile latency per API route:
histogram_quantile(0.95, rate(kiali_api_processing_duration_seconds_bucket[5m]))
- Alert: 95th Percentile Latency > 5s:
histogram_quantile(0.95, rate(kiali_api_processing_duration_seconds_bucket[5m])) > 5s
- Top 5 slowest API routes (avg latency over 5m):
topk(5, rate(kiali_api_processing_duration_seconds_sum[5m]) / rate(kiali_api_processing_duration_seconds_count[5m]))
- Graph
- Use the same queries as “API routes” but with the metric
kiali_graph_generation_duration_seconds_[count,sum,bucket] to get information about the graph generator.
- Use the same queries as “API routes” but with the metric
kiali_graph_appender_duration_seconds_[count,sum,bucket] to get information about the graph generator appenders. This helps analyze the performance of the individual appenders that are used to build and decorate the graphs.
- Tracing
- Use the same queries as “API routes” but with the metric
kiali_tracing_processing_duration_seconds_[count,sum,bucket] to get information about the groups of different Tracing queries. This helps analyze the performance of the Kiali/Tracing integration.
- Metrics
- Use the same queries as “API routes” but with the metric
kiali_prometheus_processing_duration_seconds_[count,sum,bucket] to get information about the different groups of Prometheus queries. This help analyze the performance of the Kiali/Prometheus integration.
- Validations
- Use the same queries as “API routes” but with the metric
kiali_validation_processing_duration_seconds_[count,sum,bucket] to get information about Istio configuration validation. This helps analyze the performance of Istio configuration validation as a whole.
- Use the same queries as “API routes” but with the metric
kiali_checker_processing_duration_seconds_[count,sum,bucket] to get information about the different validation checkers. This helps analyze the performance of the individual checkers performed during the Istio configuration validation.
- Failures
- Failures per API route (in the past hour):
sum by (route) (rate(kiali_api_failures_total[1h]))
- Error rate percentage per API route:
100 * sum by (route) (rate(kiali_api_failures_total[1h])) / sum by (route) (rate(kiali_api_processing_duration_seconds_count[1h]))
- The number of failures per API route in the past 30 minutes:
increase(kiali_api_failures_total[30m])
- The top 5 API routes with failures in the past 30 minutes
topk(5, increase(kiali_api_failures_total[30m]))
Tracing
Kiali provides the ability to emit debugging traces to the distributed tracing platform, Jaeger or Grafana Tempo.
From Kiali 1.79, the feature of Kiali emitting tracing data into Jaeger format has been removed.
The traces can be sent in HTTP, HTTPS or gRPC protocol. It is also possible to use TLS. When tls_enabled is set to true, one of the options skip_verify or ca_name should be specified.
The traces are sent in OTel format, indicated in the collector_type setting.
server:
  observability:
    tracing:
      collector_url: "jaeger-collector.istio-system:4317"
      enabled: true
      otel:
        protocol: "grpc"
        tls_enabled: true
        skip_verify: false
        ca_name: "/tls.crt"
Usually, the tracing platforms expose different ports to collect traces in distinct formats and protocols:
- The Jaeger collector accepts OpenTelemetry Protocol over HTTP (4318) and gRPC (4317).
- The Grafana Tempo distributor accepts OpenTelemetry Protocol over HTTP (4318) and gRPC (4317). It can be configured to accept TLS.
The traces emitted by Kiali can be searched in the Kiali workload:
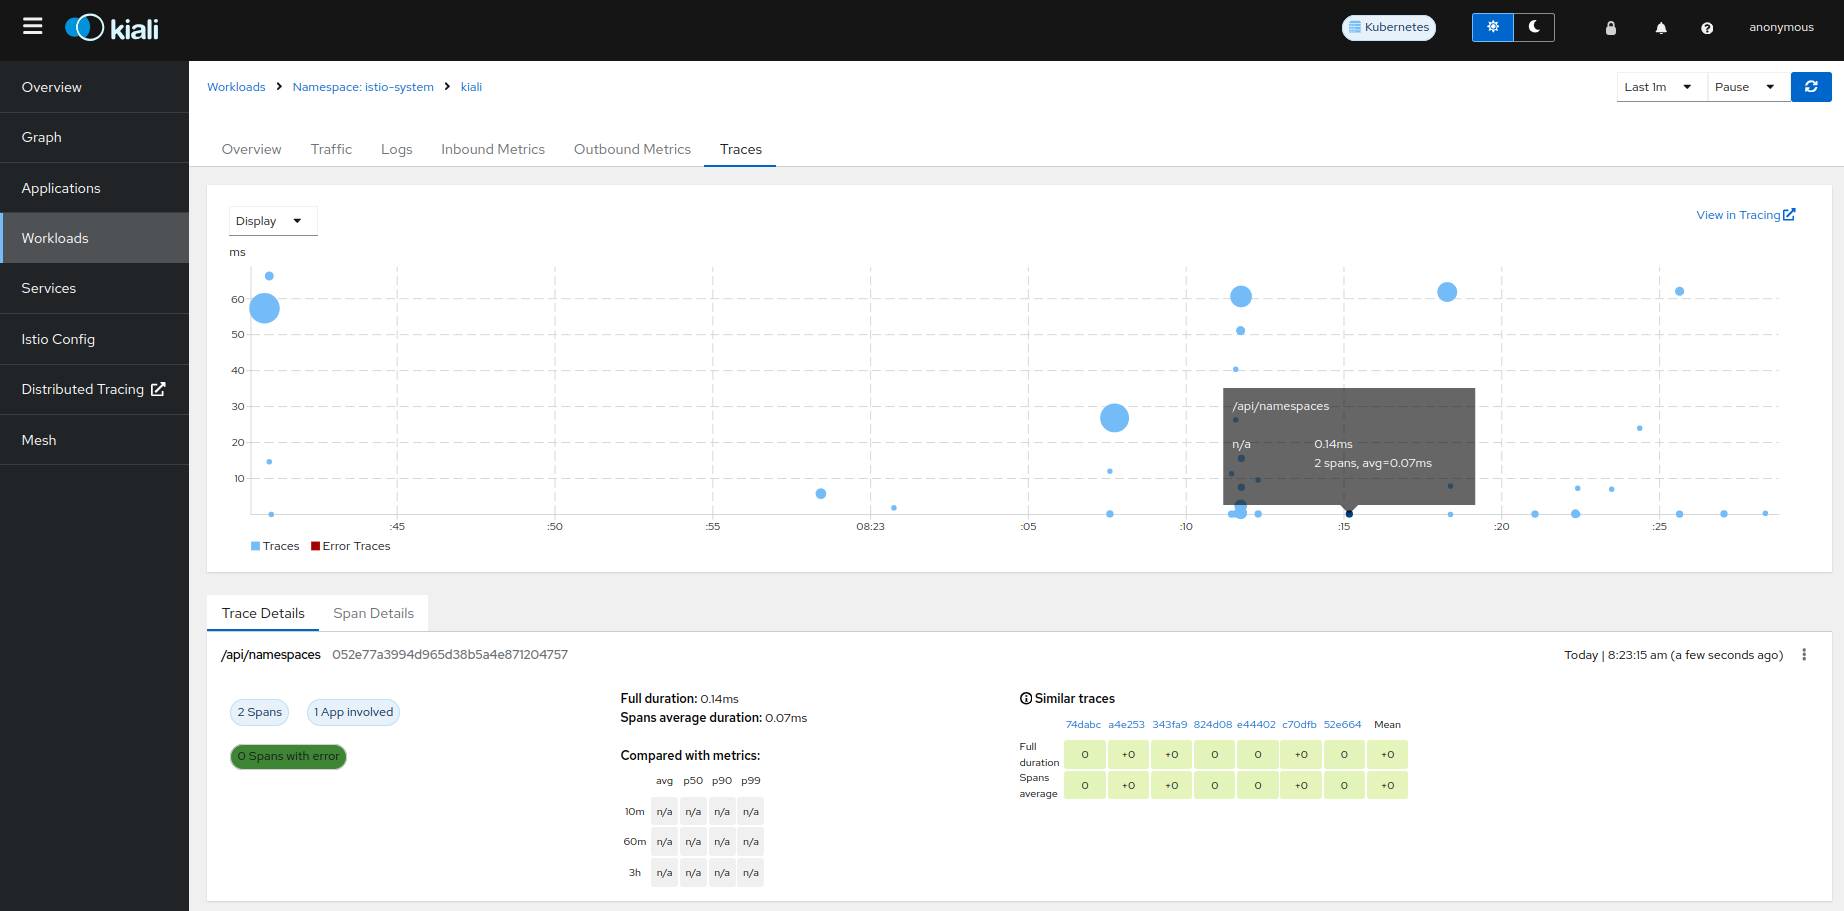
Tracing Integration
Sometimes integration with tracing can be complex, but since version 2.11, a tool is available to help with the configuration.
It’s available on the mesh page, by clicking on the tracing node. From there, under “Configuration Tester,” it will show 2 different features:
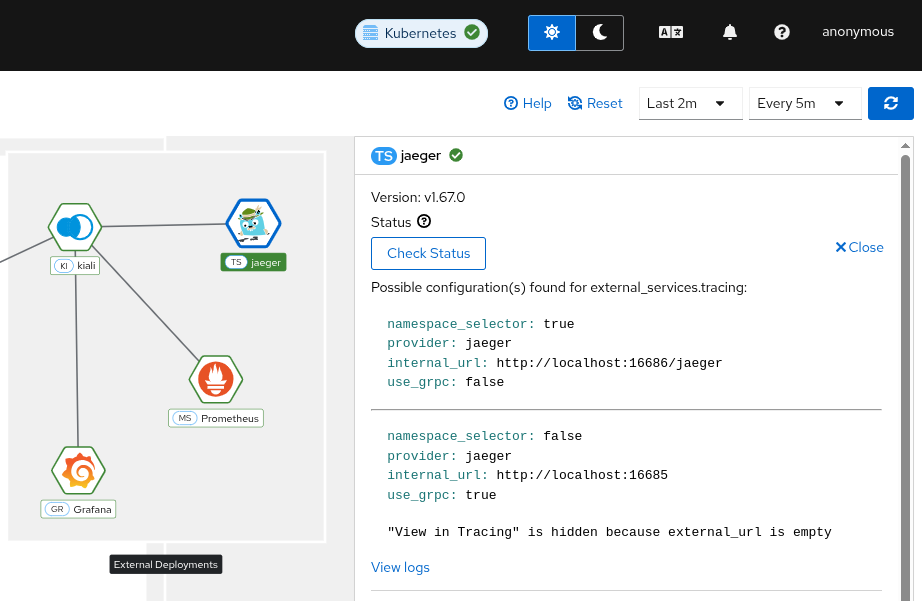
- Discovery tool
- Configuration tester
The discovery feature will show possible valid configurations that might work based on the tracing open ports.
It’s important that at least the URL is properly defined - external_services.tracing.internal_url if it’s inside the cluster, or external_services.tracing.external_url if it’s outside.
The logs section will provide more insights about the tests done, the open ports, the errors found, that can help to troubleshoot in case of more complex scenarios, like urls with tenants or https.
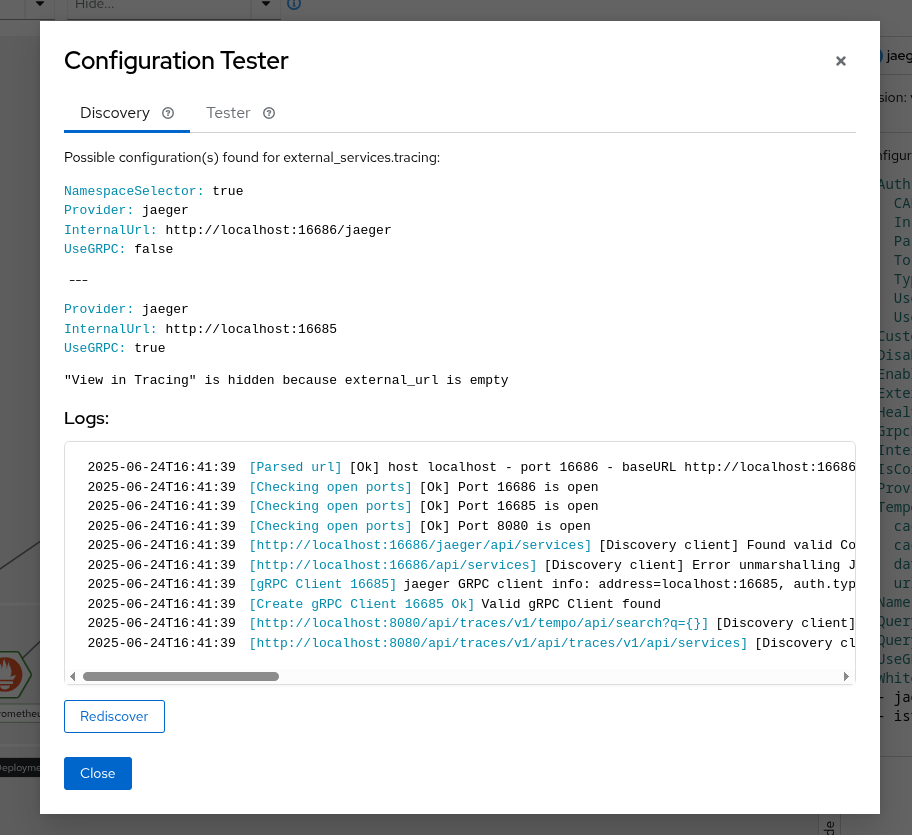
The configuration tester allows to test a specific configuration without having to edit the config map and wait for the Kiali pod to be restarted.
Please note that the configuration will not be saved permanently.
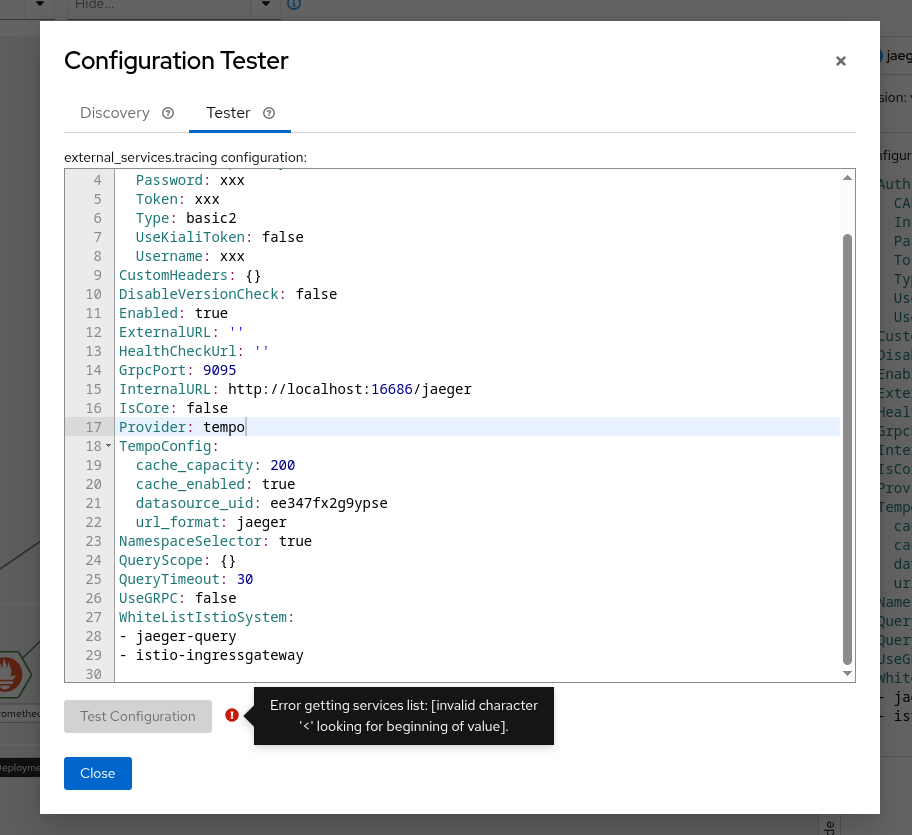
Profiler
The Kial Server is integrated with the Go pprof profiler. By default, the integration is disabled. If you want the Kiali Server to generate profile reports, enable it in the Kiali CR:
spec:
  server:
    profiler:
      enabled: true
Once the profiler is enabled, you can access the profile reports by pointing your browser to the <kiali-root-url>/debug/pprof endpoint and click the link to the profile report you want. You can obtain a specific profile report by appending the name of the profile to the URL. For example, if your Kiali Server is found at the root URL of “http://localhost:20001/kiali”, and you want the heap profile report, the URL http://localhost:20001/kiali/debug/pprof/heap will provide the data for that report.
Go provides a pprof tool that you can then use to visualize the profile report. This allows you to analyze the data to help find potential problems in the Kiali Server itself. For example, you can start the pprof UI on port 8080 which allows you to see the profile data in your browser:
go tool pprof -http :8080 http://localhost:20001/kiali/debug/pprof/heap
You can download a profile report and store it as a file for later analysis. For example:
curl -o pprof.txt http://localhost:20001/kiali/debug/pprof/heap
You can then examine the data found in the profile report:
go tool pprof -http :8080 ./pprof.txt
Your browser will be opened to http://localhost:8080/ui which allows you to see the profile report.
Kiali CR Status
When you install the Kiali Server via the Kiali Operator, you do so by creating a Kiali CR. One quick way to debug the status of a Kiali Server installation is to look at the Kiali CR’s status field (e.g. kubectl get kiali --all-namespaces -o jsonpath='{..status}'). The operator will report any installation errors within this Kiali CR status. If the Kiali Server fails to install, always check the Kiali CR status field first because in many instances you will find an error message there that can provide clear guidance on what to do next.
Debugging the Kiali Operator
The Kiali Operator is built on the Ansible Operator SDK. It has multiple independent logging controls that each affect a different subsystem. They are listed here in order of how commonly they are needed for debugging.
Ansible Playbook Verbosity
This controls how verbose the Ansible playbook output is during reconciliation (equivalent to the -v, -vv, -vvv flags passed to ansible-runner). This is useful for debugging issues within the Ansible playbook logic itself, such as seeing the values of variables or the details of each task.
Set the ansible.sdk.operatorframework.io/verbosity annotation on the Kiali or OSSMConsole CR. The value is an integer from 0 (default, no extra verbosity) to 5 (most verbose):
metadata:
  annotations:
    ansible.sdk.operatorframework.io/verbosity: "1"
See the Ansible Operator SDK advanced options documentation for more details on this.
Ansible Debug Logs
When set to true, this causes the operator to print the full ansible-runner stdout after each reconciliation completes. This is useful for seeing the complete Ansible output including all task results.
When Installed via Helm
Set the debug.enabled value:
helm upgrade kiali-operator kiali/kiali-operator --set debug.enabled=true
When Installed via OLM
Add the environment variable to the Subscription’s spec.config.env:
spec:
  config:
    env:
    - name: ANSIBLE_DEBUG_LOGS
      value: "true"
Go Structured Log Level
--zap-log-level controls the log level of the Go-based controller-runtime framework that manages the operator’s reconciliation loop. This is the setting needed for diagnosing why reconciliation is being triggered, which is typically only necessary when investigating unexpected or periodic reconciliations.
The supported levels are:
info: Logs startup information, controller events, and proxy cache reads.debug: Additionally logs the event handler messages that tell you exactly what event triggered each reconciliation.
When set to debug, the operator will emit a log message like the following immediately before each reconciliation:
{"level":"debug","ts":"2026-02-10T20:06:23Z","logger":"ansible.handler","msg":"Metrics handler event","Event type":"Update","GroupVersionKind":"kiali.io/v1alpha1, Kind=Kiali","Name":"kiali","Namespace":"kiali-operator"}
The key fields in this message are:
Event type: One of Create, Update, Delete, or Generic - tells you what kind of change triggered the reconciliation.GroupVersionKind: Which resource type changed (e.g. kiali.io/v1alpha1, Kind=Kiali or kiali.io/v1alpha1, Kind=OSSMConsole).Name / Namespace: Which specific CR instance was affected.
To find these messages in the logs:
kubectl logs deployment/kiali-operator -n <operator-namespace> | grep 'ansible.handler'
The Go log level is controlled by the --zap-log-level container argument on the operator deployment. The method for changing this depends on how the operator was installed.
When Installed via Helm
When the operator is installed via Helm, you can patch the Deployment directly since there is no OLM to revert the change:
kubectl patch deployment kiali-operator -n <operator-namespace> --type='json' \
  -p='[{"op":"replace","path":"/spec/template/spec/containers/0/args/0","value":"--zap-log-level=debug"}]'
To revert back to normal logging, just run that command again with the --zap-log-level set back to info.
When Installed via OLM
When the operator is installed via OLM (Operator Lifecycle Manager), you cannot patch the Deployment directly because OLM will revert the change. The OLM Subscription config also does not support overriding container args. Instead, you must patch the ClusterServiceVersion (CSV), which OLM treats as the authoritative source for the deployment spec.
To enable debug logging:
kubectl patch csv $(kubectl get csv -n <operator-namespace> --no-headers -o custom-columns=NAME:.metadata.name | grep '^kiali-operator') \
  -n <operator-namespace> --type='json' \
  -p='[{"op":"replace","path":"/spec/install/spec/deployments/0/spec/template/spec/containers/0/args/0","value":"--zap-log-level=debug"}]'
OLM will automatically roll out a new operator pod with the updated args.
To revert back to normal logging, just run that command again with the --zap-log-level set back to info.
On OpenShift, the operator namespace is typically openshift-operators. On vanilla Kubernetes with OLM, it is typically operators.
Ansible Task Profiler
The operator includes an Ansible task profiler that uses the profile_tasks Ansible callback plugin. When enabled, it logs the execution time of each Ansible task to the operator pod’s log output at the end of each reconciliation run. This is useful for identifying slow tasks in the operator’s Ansible playbooks.
When Installed via Helm
Set the debug.enableProfiler value:
helm upgrade kiali-operator kiali/kiali-operator --set debug.enableProfiler=true
When Installed via OLM
Set the ANSIBLE_CONFIG environment variable to the profiler configuration in the Subscription’s spec.config.env:
spec:
  config:
    env:
    - name: ANSIBLE_CONFIG
      value: "/opt/ansible/ansible-profiler.cfg"
To disable the profiler, set the value back to /etc/ansible/ansible.cfg.
Examples
The following are just some examples of how you can use the Kiali signals to help diagnose problems within Kiali itself.
Use log messages to find out what is slow
The examples below assume Kiali is outputting logs in JSON format (spec.deployment.logger.log_format = json). Use grep, sed, and related tools to query logs if Kiali is logging the output as text.
Make sure you turn on trace logging (spec.deployment.logger.log_level = trace) in order to get the log messages needed for this kind of analysis.
Find all the logs that show APIs with long execution times. Because Kiali is not logging times faster than 3 seconds, this query will return all the routes (i.e. the API endpoints) that were 3 seconds or slower:
kubectl logs -n istio-system deployments/kiali | \
  jq -rR 'fromjson? | select(.timer) | .route' | \
  sort -u
Suppose that returned only one route name - GraphNamespaces. This means the main graph page was slow. Let’s examine the logs for a request for that API. We first find the ID of the last request that was made for the GraphNamespaces API:
kubectl logs -n istio-system deployments/kiali | \
  jq -rR 'fromjson? | select(.route == "GraphNamespaces") | .["request-id"]' | tail -n 1
Take the ID string that was output (in this example, it is d0staq6nq35s73b6mdug) and use it to examine the logs for that request only:
kubectl logs -n istio-system deployments/kiali | \
  jq -rR 'fromjson? | select(."request-id" == "d0staq6nq35s73b6mdug")'
To make the output less verbose, we can eliminate some of the message’s attributes that we do not need to see:
kubectl logs -n istio-system deployments/kiali | \
  jq -rR 'fromjson? | select(."request-id" == "d0staq6nq35s73b6mdug") | \
  del(.["level", "route", "route-pattern", "group", "request-id"])'
The output of that command is the log messages, in chronological order, as the request to generate the graph was processed in the Kiali server. Examining timestamps, timer durations, warnings, and other data in these messages can help determine what made the request slow:
{
  "ts": "2025-05-30T15:57:28Z",
  "msg": "Build [versionedApp] graph for [1] namespaces [map[bookinfo:{bookinfo 1m0s false false}]]"
}
{
  "ts": "2025-05-30T15:57:28Z",
  "msg": "Build traffic map for namespace [{bookinfo 1m0s false false}]"
}
{
  "appender": "workloadEntry",
  "ts": "2025-05-30T15:57:28Z",
  "msg": "Running workload entry appender"
}
{
  "appender": "workloadEntry",
  "ts": "2025-05-30T15:57:28Z",
  "msg": "WorkloadEntries found: 0"
}
{
  "appender": "workloadEntry",
  "ts": "2025-05-30T15:57:28Z",
  "msg": "WorkloadEntries found: 0"
}
{
  "appender": "workloadEntry",
  "ts": "2025-05-30T15:57:28Z",
  "msg": "WorkloadEntries found: 0"
}
{
  "appender": "workloadEntry",
  "ts": "2025-05-30T15:57:28Z",
  "msg": "WorkloadEntries found: 0"
}
{
  "appender": "workloadEntry",
  "ts": "2025-05-30T15:57:28Z",
  "msg": "WorkloadEntries found: 0"
}
{
  "appender": "workloadEntry",
  "ts": "2025-05-30T15:57:28Z",
  "msg": "WorkloadEntries found: 0"
}
{
  "appender": "workloadEntry",
  "ts": "2025-05-30T15:57:28Z",
  "msg": "WorkloadEntries found: 0"
}
{
  "appender": "idleNode",
  "namespace": "bookinfo",
  "timer": "GraphAppenderTime",
  "duration": "3.153312011s",
  "ts": "2025-05-30T15:57:31Z",
  "msg": "Namespace graph appender time"
}
{
  "ts": "2025-05-30T15:57:31Z",
  "msg": "Generating config for [common] graph..."
}
{
  "ts": "2025-05-30T15:57:31Z",
  "msg": "Done generating config for [common] graph"
}
{
  "inject-service-nodes": "true",
  "graph-kind": "namespace",
  "graph-type": "versionedApp",
  "timer": "GraphGenerationTime",
  "duration": "3.280609145s",
  "ts": "2025-05-30T15:57:31Z",
  "msg": "Namespace graph generation time"
}
{
  "status-code": "200",
  "timer": "APIProcessingTime",
  "duration": "3.280986943s",
  "ts": "2025-05-30T15:57:31Z",
  "msg": "API processing time"
}
Examining those log messages of a single request to generate the graph easily shows that the idleNode graph appender code is very slow (taking over 3 seconds to complete). Thus, the first thing that should be suspected as the cause of the slow graph generation is the code that generates idle nodes in the graph.
Use Prometheus to find out what is slow
You can use Prometheus to look at Kiali’s metrics to help analyze problems. Even though Kiali does not log metric timers that are faster than 3 seconds, those metrics are still stored in Prometheus.
We can look at the metrics that are emitted by the graph appenders to see how they are performing. This shows the top-5 slowest graph appenders for this specific Kiali environment - and here we see the idleNode appender is by far the worst offender. Again, this helps pin-point a cause of slow graph generation - in this case, the idleNode graph appender code:
Prometheus query: topk(5, rate(kiali_graph_appender_duration_seconds_sum[5m]) / rate(kiali_graph_appender_duration_seconds_count[5m]))
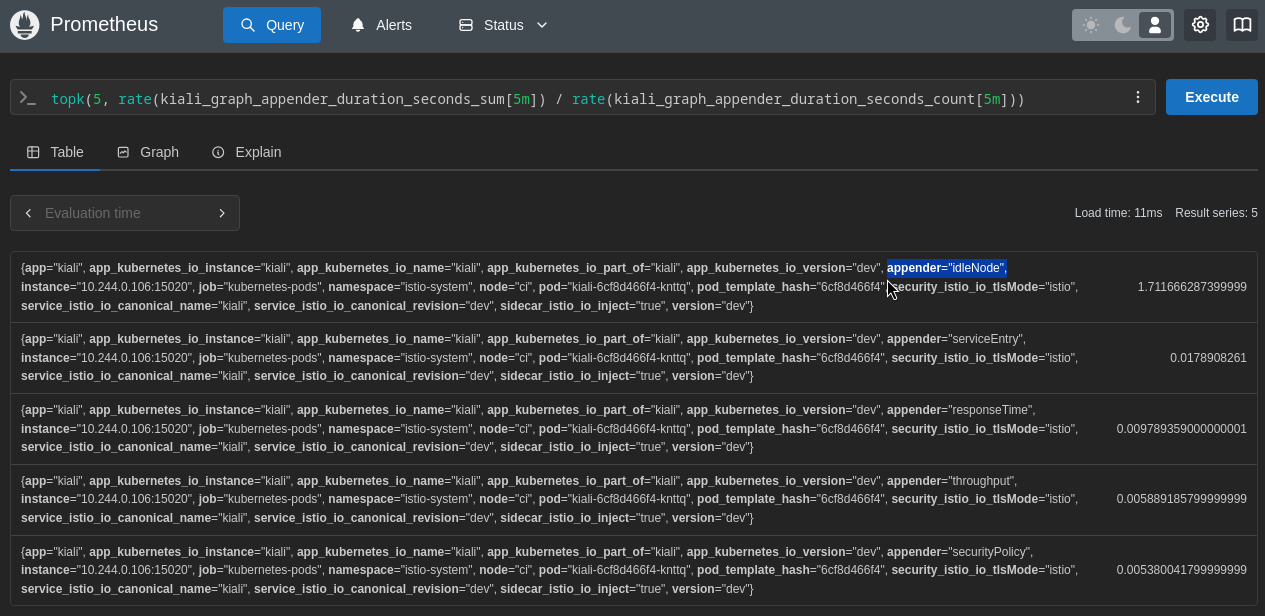
If you are not sure what exactly is slowing down the Kiali Server, one of the first things to examine is the duration of time each API takes to complete. Here are the top-2 slowest Kiali APIs for this specific Kiali environment:
Prometheus query: topk(2, rate(kiali_api_processing_duration_seconds_sum[5m]) / rate(kiali_api_processing_duration_seconds_count[5m]))
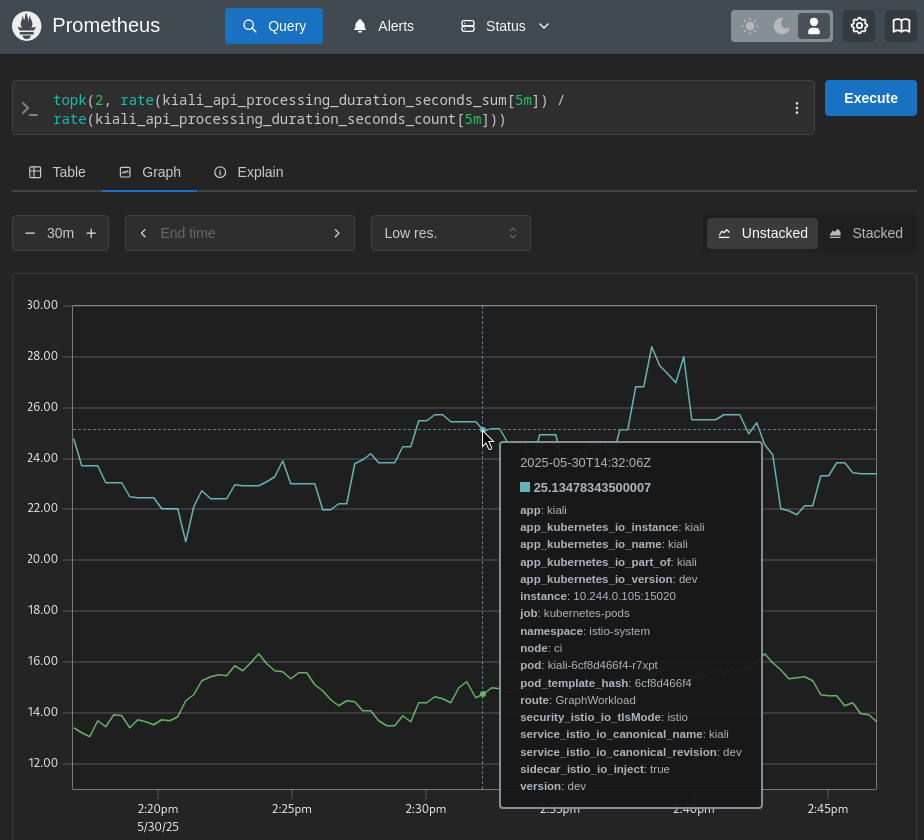
The above shows that the graph generation is slow. So let’s next look at the graph appenders to see if any one of them could be the culprit of the poor performance:
Prometheus query: topk(5, rate(kiali_graph_appender_duration_seconds_sum[5m]) / rate(kiali_graph_appender_duration_seconds_count[5m]))
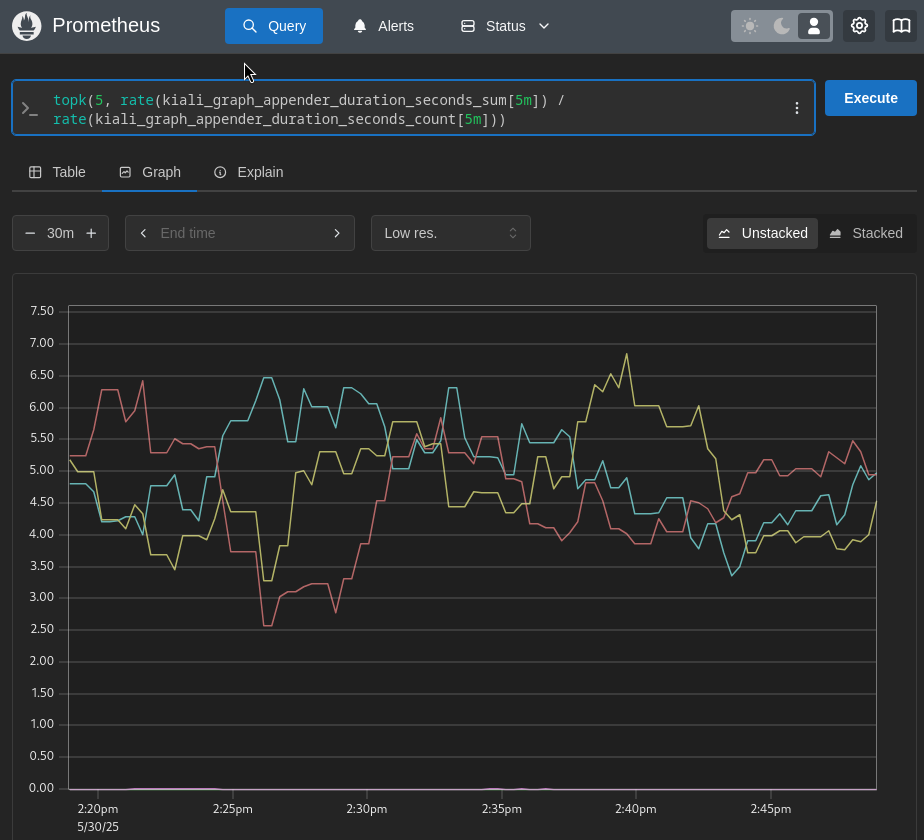
In this specific case, it does not look like any one of the appenders is the source of the problem. They all appear to be having issues with poor performance. Since the graph generation relies heavily on querying the Prometheus server, another thing to check is the time it takes for Kiali to query Prometheus:
Prometheus query: topk(5, rate(kiali_prometheus_processing_duration_seconds_sum[5m]) / rate(kiali_prometheus_processing_duration_seconds_count[5m]))
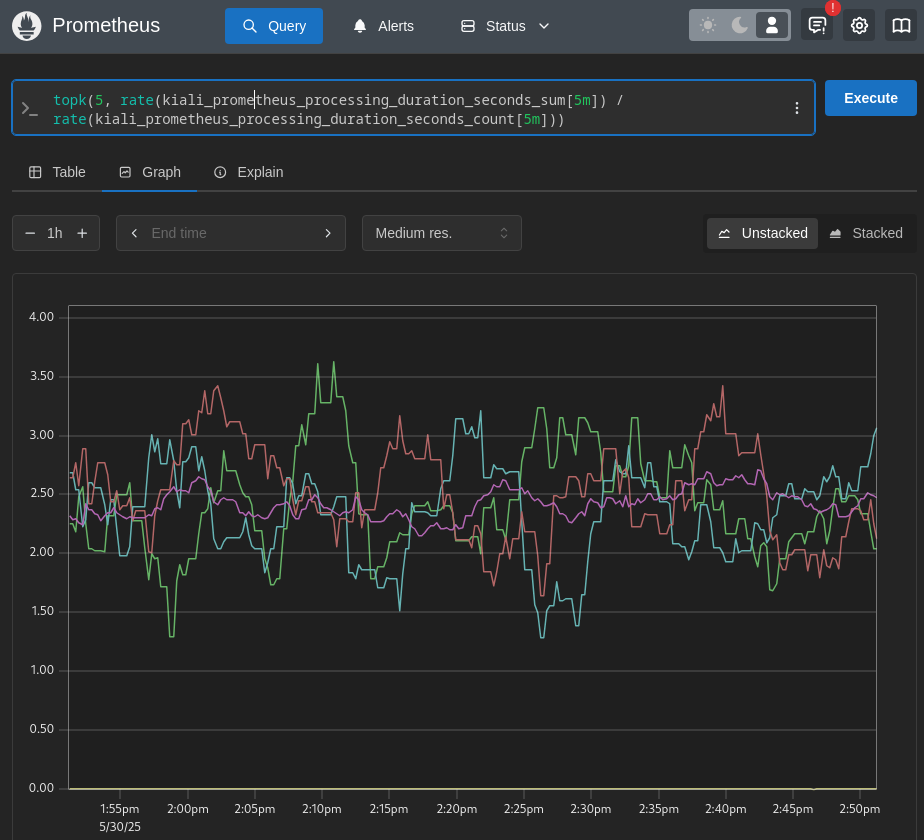
Here it looks like Prometheus itself might be the source of the poor performance. All of the Prometheus queries Kiali is requesting are taking over a full second to complete (some are taking as much as 3.5 seconds). At this point, you should check the Prometheus server and the network connection between Kiali and Prometheus as possible causes of the slow Kiali performance. Perhaps Kiali is asking for so much data from Prometheus, Prometheus cannot keep up. Perhaps there is a network outage causing the Kiali requests to Prometheus being slow. But at least in this case we’ve pin-pointed a bottleneck and can narrow our focus when searching for the root cause of the problem.
Use Kiali to find out what is slow
Kiali itself can be used to help find its own internal problems.
Navigate to the Kiali workload, and select the Kiali Internal Metrics tab. In this case, we can see some APIs are very slow due to the high p99 and average values. We can eliminate the tracing integration as the source of the problem because all processing of tracing requests are taking an average of about 20ms to complete. However, the graph generation appears to be very slow, taking an average of between 15 and 30 seconds to complete each request:
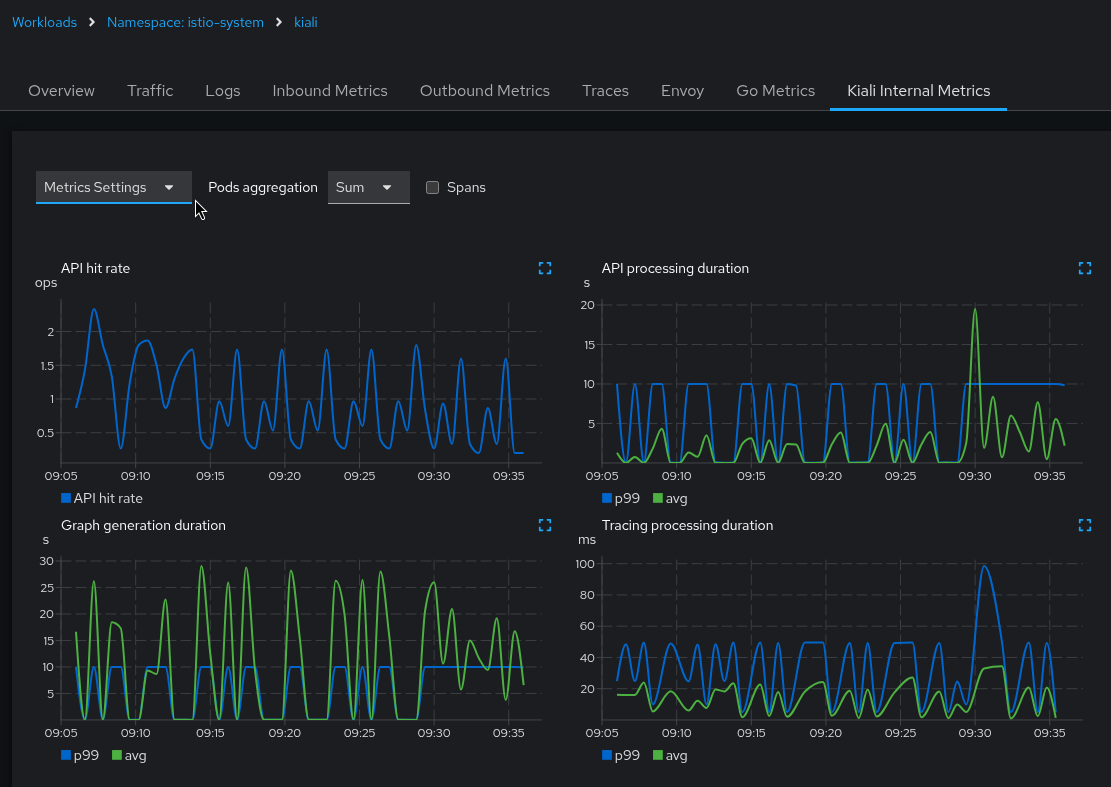
The Kiali UI allows you to expand each mini-chart into a full size chart for easier viewing. You can also display the different metric labels as separate chart lines. In this case, the graph is showing the duration times for the GraphNamespaces and GraphWorkload APIs:
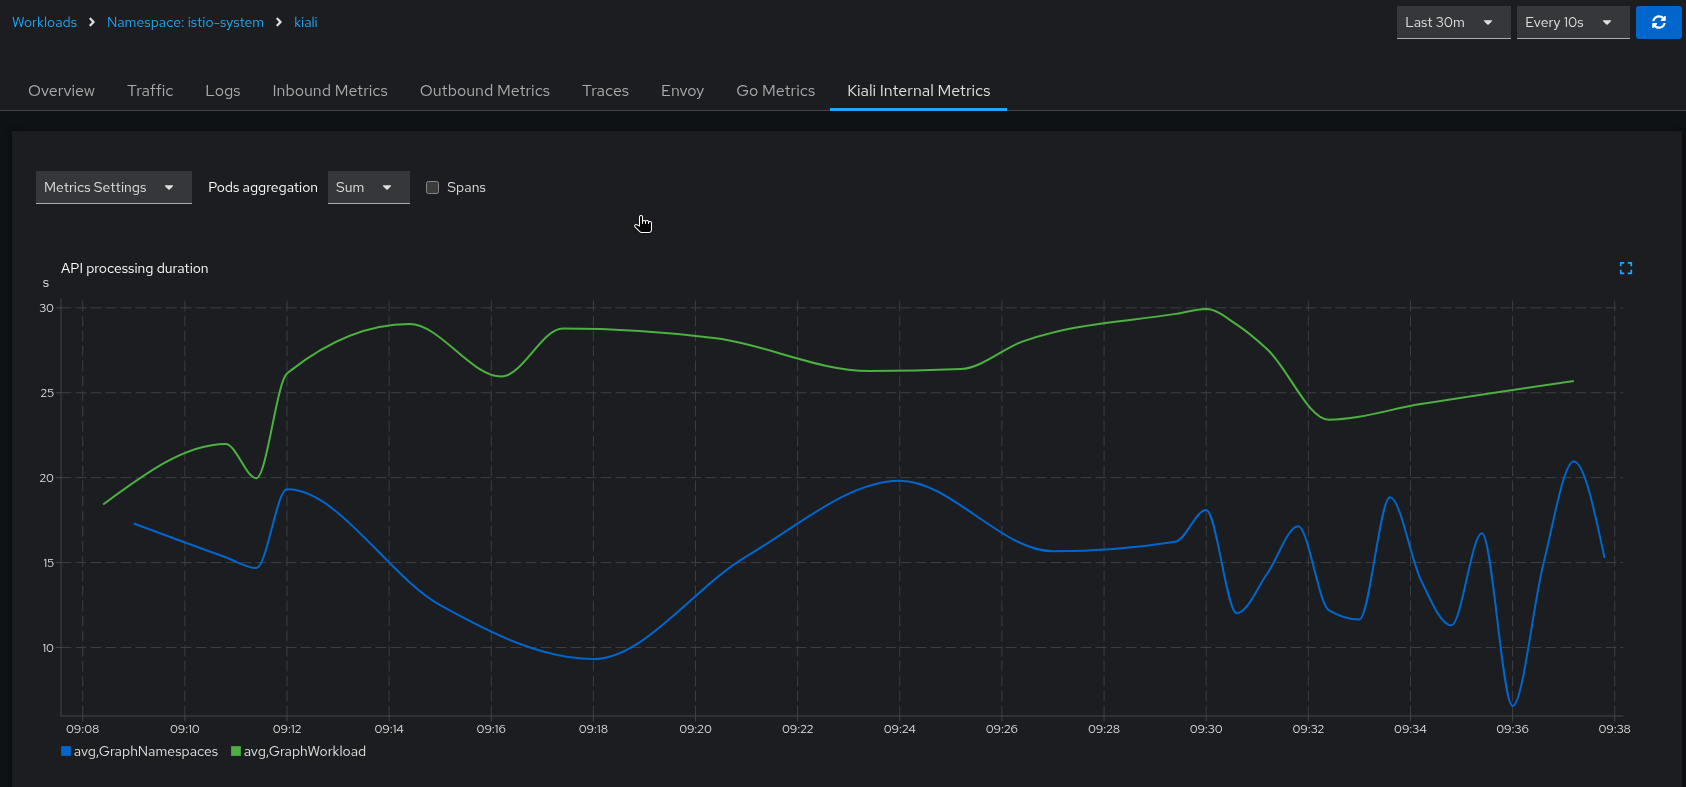
The above metric charts clearly show a performance problem in the graph generation. Because the graph generation code requests many Prometheus queries, one of the next things to check is the performance of the Kiali-Prometheus integration. One fast and easy way to see how the Prometheus queries are performing is to look at the Kiali workload’s Overview tab, specifically, the graph shown on the right side. Look at the edge between the Kiali node and the Prometheus node for indications of problems (the edge label will show you throughput numbers; the color of the edge will indicate request errors):
This traffic data between Kiali and Prometheus is only available if Kiali is located inside the mesh (e.g. Kiali has an Istio sidecar).
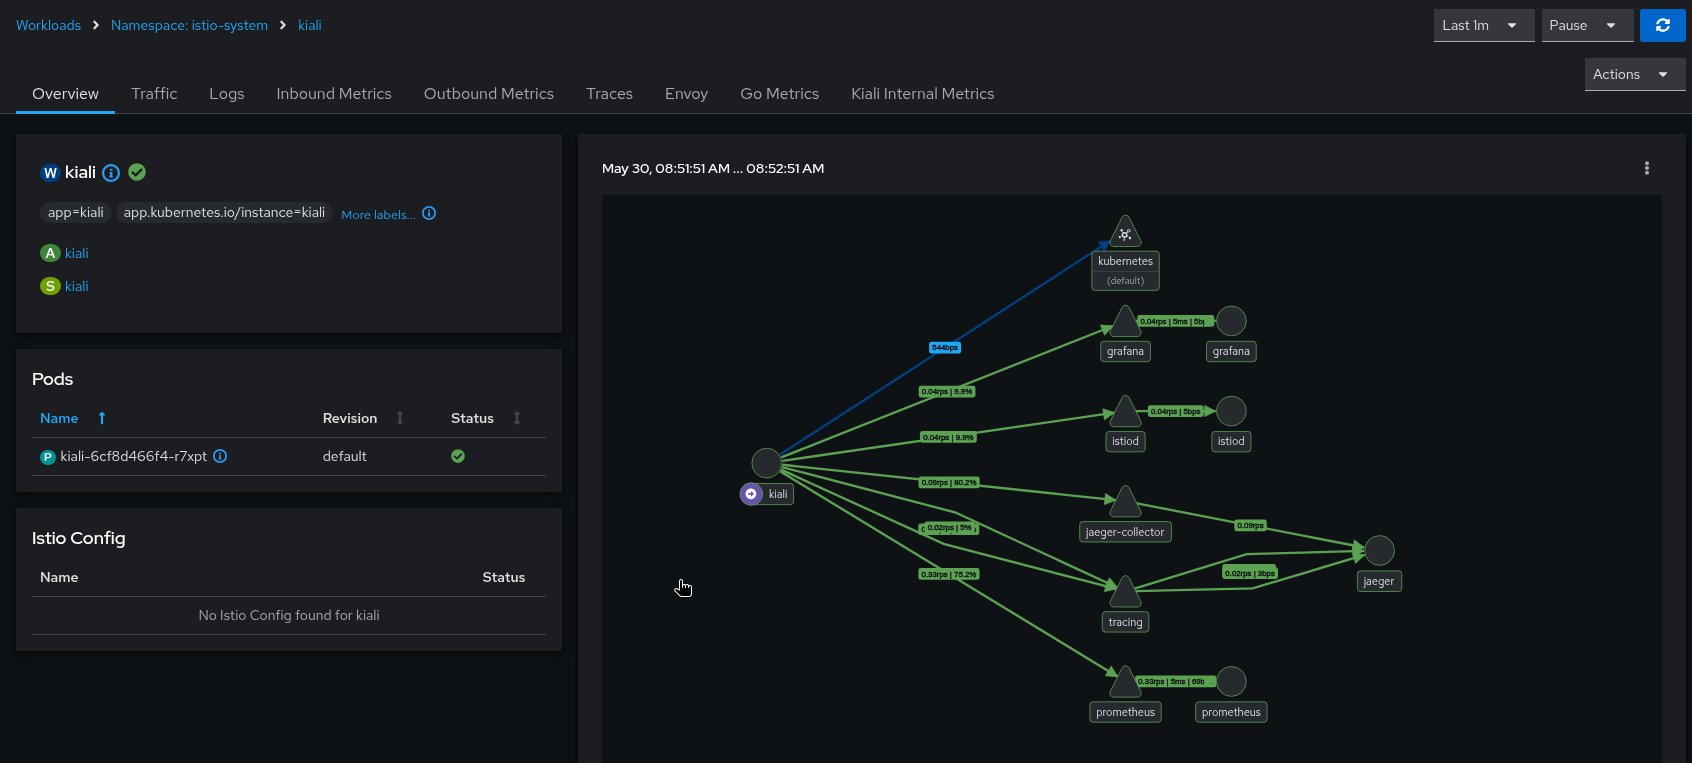
5 - Istio Environment
Labels and resource names
Istio recommends adding app and version labels to
pods to attach this information to telemetry. Kiali relies on correctness of these labels for several features.
In Istio, it is possible to use a different set of labels, like
app.kubernetes.io/name and app.kubernetes.io/version, however you must
configure Kiali to the labels you are using. By default, Kiali uses Istio’s
recommended labels:
spec:
  istio_labels:
    app_label_name: "app"
    version_label_name: "version"
Although Istio lets you use different labels on different pods, Kiali can only
use a single set.
For example, Istio lets you use the app label in one pod and the
app.kubernetes.io/name in another pod and it will generate telemetry
correctly. However, you will have no way to configure Kiali for this case.
Root namespace
Istio’s root namespace is the namespace where you can create some resources
to define default Istio configurations and adapt Istio behavior to your
environment. For more information on this Istio configuration, check the Istio
docs Global Mesh options
page and
search for “rootNamespace”.
Kiali uses the root namespace for some of the validations of Istio resources.
Kiali automatically detects the root namespace for each Istio control plane,
so no manual configuration is required. This enables Kiali to properly support
environments with multiple Istio control planes, where each control plane may
have a different root namespace.
Prior to Kiali v2.16, the root namespace was configured manually via the
external_services.istio.root_namespace setting. This configuration option
has been removed as Kiali now autodetects the appropriate root namespace
for each control plane.
Sidecar injection, canary upgrade management and Istio revisions
Kiali can assist with configuring automatic sidecar injection and
migrating workloads from an old Istio version to a newer
one using the canary upgrade
method. Kiali uses the
standard Istio labels to control sidecar injection
policy
and canary upgrades.
Management of sidecar injection is enabled by default. If you don’t want this
feature, you can disable it with the following configuration:
spec:
  kiali_feature_flags:
    istio_injection_action: false
Using Kiali to apply revision labels through the UI during a canary
upgrade is turned off by default. You can enable this in Kiali with the following configuration:
spec:
  kiali_feature_flags:
    # Turns on canary upgrade support
    istio_upgrade_action: true
Upgrade actions appear in the Namespaces page actions menu (Kiali >= 2.23).
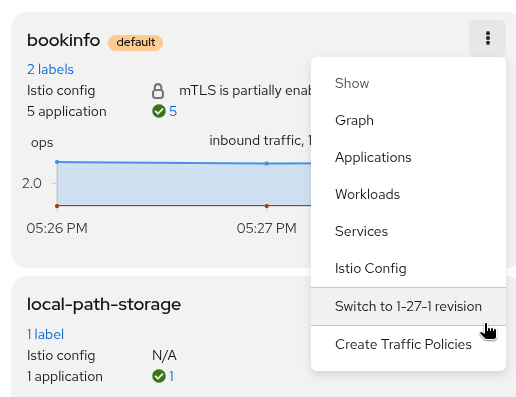
The progress of the canary upgrade process can be tracked on the mesh page, which displays the namespaces pending migration to the canary Istio control plane.
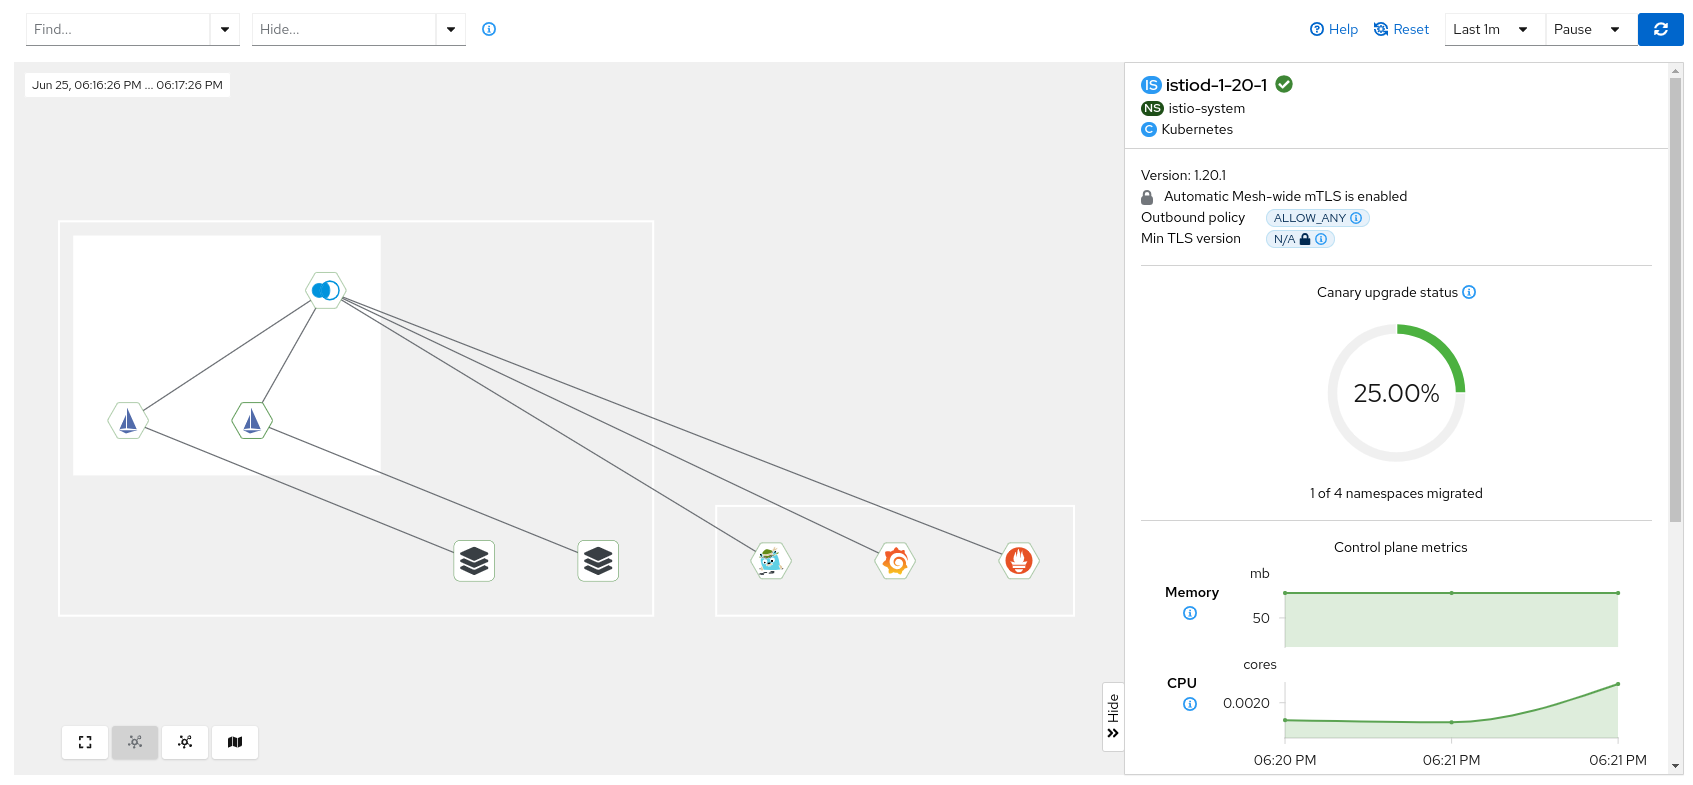
There following are links to sections of Kiali blogs posts that briefly
explains these features:
6 - Kiali CR Reference
Reference page for the Kiali CR.
The Kiali Operator will watch for resources of this type and install Kiali according to those resources’ configurations.
Example CR
(all values shown here are the defaults unless otherwise noted)
apiVersion: kiali.io/v1alpha1
kind: Kiali
metadata:
  name: kiali
  annotations:
    ansible.sdk.operatorframework.io/verbosity: "1"
spec:
  additional_display_details:
  - title: "API Documentation"
    annotation: "kiali.io/api-spec"
    icon_annotation: "kiali.io/api-type"

  installation_tag: ""

  version: "default"

  auth:
    strategy: ""
    openid:
      # default: additional_request_params is empty
      additional_request_params:
        openIdReqParam: "openIdReqParamValue"
      # default: allowed_domains is an empty list
      allowed_domains: ["allowed.domain"]
      api_proxy: ""
      api_proxy_ca_data: ""
      api_token: "id_token"
      authentication_timeout: 300
      authorization_endpoint: ""
      client_id: ""
      disable_rbac: false
      http_proxy: ""
      https_proxy: ""
      insecure_skip_verify_tls: false
      issuer_uri: ""
      scopes: ["openid", "profile", "email"]
      username_claim: "sub"
      discovery_override:
        authorization_endpoint: ""
        jwks_uri: ""
        token_endpoint: ""
        userinfo_endpoint: ""
    openshift:
      #redirect_uris:
      #token_inactivity_timeout:
      #token_max_age:

  chat_ai:
    default_provider: ""
    enabled: false
    providers: []
    store_config:
      enabled: true
      max_cache_memory_mb: 1024
      reduce_threshold: 15
      reduce_with_ai: false

  clustering:
    autodetect_secrets:
      enabled: true
      label: "kiali.io/multiCluster=true"
    clusters: []
    ignore_home_cluster: false
    kiali_urls: []

  # default: custom_dashboards is an empty list
  custom_dashboards:
  - name: "envoy"

  deployment:
    additional_pod_containers_yaml: []
    additional_pod_init_containers_yaml: []
    # default: additional_service_yaml is empty
    additional_service_yaml:
      externalName: "kiali.example.com"
    affinity:
      # default: node is empty
      node:
        requiredDuringSchedulingIgnoredDuringExecution:
          nodeSelectorTerms:
          - matchExpressions:
            - key: kubernetes.io/e2e-az-name
              operator: In
              values:
              - e2e-az1
              - e2e-az2
      # default: pod is empty
      pod:
        requiredDuringSchedulingIgnoredDuringExecution:
        - labelSelector:
            matchExpressions:
            - key: security
              operator: In
              values:
              - S1
          topologyKey: topology.kubernetes.io/zone
      # default: pod_anti is empty
      pod_anti:
        preferredDuringSchedulingIgnoredDuringExecution:
        - weight: 100
          podAffinityTerm:
            labelSelector:
              matchExpressions:
              - key: security
                operator: In
                values:
                - S2
            topologyKey: topology.kubernetes.io/zone
    cluster_wide_access: true
    # default: configmap_annotations is empty
    configmap_annotations:
      strategy.spinnaker.io/versioned: "false"
    # default: custom_envs is an empty list
    custom_envs:
    - name: "HTTP_PROXY"
      value: "http://my.proxy.com:1234"
    - name: "NO_PROXY"
      value: "hostname.example.com"
    # default: custom_secrets is an empty list
    custom_secrets:
    - name: "a-custom-secret"
      mount: "/a-custom-secret-path"
      optional: true
    - name: "a-csi-secret"
      mount: "/a-csi-secret-path"
      csi:
        driver: secrets-store.csi.k8s.io
        readOnly: true
        volumeAttributes:
          secretProviderClass: kiali-secretprovider
    # default: discovery_selectors is empty
    discovery_selectors:
      default:
      - matchLabels:
          region: north
      - matchExpressions:
        - key: organization
          operator: "In"
          values: ["engineering", "accounting"]
      - matchLabels:
          region: south
        matchExpressions:
        - key: app
          operator: "DoesNotExist"
        - key: domain
          operator: "NotIn"
          values: ["production"]
      overrides:
        myRemoteCluster:
        - matchLabels:
            region: world
        - matchExpressions:
          - key: organization
            operator: "NotIn"
            values: ["marketing"]
        - matchLabels:
            region: antarctica
          matchExpressions:
          - key: app
            operator: "DoesNotExist"
          - key: domain
            operator: "In"
            values: ["staging"]
    dns:
      # default: config is empty
      config:
        options:
        - name: ndots
          value: "1"
      # default: policy is empty
      policy: "ClusterFirst"
    extra_labels: {}
    # default: host_aliases is an empty list
    host_aliases:
    - ip: "192.168.1.100"
      hostnames:
      - "foo.local"
      - "bar.local"
    hpa:
      api_version: ""
      # default: spec is empty
      spec:
        maxReplicas: 2
        minReplicas: 1
        metrics:
        - type: Resource
          resource:
            name: cpu
            target:
              type: Utilization
              averageUtilization: 50
    image_digest: ""
    image_name: ""
    image_pull_policy: "IfNotPresent"
    # default: image_pull_secrets is an empty list
    image_pull_secrets: ["image.pull.secret"]
    image_version: ""
    ingress:
      # default: additional_labels is empty
      additional_labels:
        ingressAdditionalLabel: "ingressAdditionalLabelValue"
      class_name: "nginx"
      # default: enabled is undefined
      enabled: false
      # default: override_yaml is undefined
      override_yaml:
        metadata:
          annotations:
            nginx.ingress.kubernetes.io/secure-backends: "true"
            nginx.ingress.kubernetes.io/backend-protocol: "HTTPS"
        spec:
          rules:
          - http:
              paths:
              - path: "/kiali"
                pathType: Prefix
                backend:
                  service:
                    name: "kiali"
                    port:
                      number: 20001
    instance_name: "kiali"
    logger:
      log_level: "info"
      log_format: "text"
      sampler_rate: "1"
      time_field_format: "2006-01-02T15:04:05Z07:00"
    namespace: "istio-system"
    network_policy:
      enabled: true
    # default: node_selector is empty
    node_selector:
      nodeSelector: "nodeSelectorValue"
    # default: pod_annotations is empty
    pod_annotations:
      proxy.istio.io/config: '{ "holdApplicationUntilProxyStarts": true }'
    # default: pod_labels is empty
    pod_labels:
      sidecar.istio.io/inject: "true"
    priority_class_name: ""
    probes:
      liveness:
        initial_delay_seconds: 5
        period_seconds: 30
      readiness:
        initial_delay_seconds: 5
        period_seconds: 30
      startup:
        failure_threshold: 6
        initial_delay_seconds: 30
        period_seconds: 10
    remote_cluster_resources_only: false
    replicas: 1
    # default: resources is undefined
    resources:
      requests:
        cpu: "10m"
        memory: "64Mi"
      limits:
        memory: "1Gi"
    secret_name: "kiali"
    security_context: {}
    # default: service_annotations is empty
    service_annotations:
      svcAnnotation: "svcAnnotationValue"
    # default: service_type is undefined
    service_type: "NodePort"
    strategy: {}
    # default: tolerations is an empty list
    tolerations:
    - key: "example-key"
      operator: "Exists"
      effect: "NoSchedule"
    topology_spread_constraints: []
    version_label: ""
    view_only_mode: false

  # default: extensions is an empty list
  extensions:
  - enabled: true
    name: "skupper"

  external_services:
    custom_dashboards:
      discovery_auto_threshold: 10
      discovery_enabled: "auto"
      enabled: true
      is_core: false
      namespace_label: "namespace"
      prometheus:
        auth:
          insecure_skip_verify: false
          password: ""
          token: ""
          type: "none"
          use_kiali_token: false
          username: ""
        cache_duration: 7
        cache_enabled: true
        cache_expiration: 300
        # default: custom_headers is empty
        custom_headers:
          customHeader1: "customHeader1Value"
        health_check_url: ""
        is_core: true
        # default: query_scope is empty
        query_scope:
          mesh_id: "mesh-1"
          cluster: "cluster-east"
        thanos_proxy:
          enabled: false
          retention_period: "7d"
          scrape_interval: "30s"
        url: ""
    grafana:
      auth:
        insecure_skip_verify: false
        password: ""
        token: ""
        type: "none"
        use_kiali_token: false
        username: ""
      dashboards:
      - name: "Istio Service Dashboard"
        variables:
          datasource: "var-datasource"
          namespace: "var-namespace"
          service: "var-service"
          version: "var-version"
      - name: "Istio Workload Dashboard"
        variables:
          datasource: "var-datasource"
          namespace: "var-namespace"
          workload: "var-workload"
          version: "var-version"
      - name: "Istio Mesh Dashboard"
      - name: "Istio Control Plane Dashboard"
      - name: "Istio Performance Dashboard"
      - name: "Istio Wasm Extension Dashboard"
      datasource_uid: ""
      enabled: true
      external_url: ""
      health_check_url: ""
      internal_url: "http://grafana.istio-system:3000"
      is_core: false
    istio:
      component_status:
        components: []
        enabled: true
      gateway_api_classes: []
      gateway_api_classes_label_selector: ""
      istio_api_enabled: true
      istio_identity_domain: "svc.cluster.local"
      istiod_polling_interval_seconds: 20
      validation_change_detection_enabled: true
      validation_reconcile_interval: "1m"
    perses:
      auth:
        insecure_skip_verify: false
        password: ""
        type: "none"
        use_kiali_token: false
        username: ""
      dashboards:
      - name: "Istio Service Dashboard"
        variables:
          datasource: "var-datasource"
          namespace: "var-namespace"
          service: "var-service"
          version: "var-version"
      - name: "Istio Workload Dashboard"
        variables:
          datasource: "var-datasource"
          namespace: "var-namespace"
          workload: "var-workload"
          version: "var-version"
      - name: "Istio Mesh Dashboard"
      - name: "Istio Control Plane Dashboard"
      - name: "Istio Performance Dashboard"
      - name: "Istio Wasm Extension Dashboard"
      enabled: false
      external_url: ""
      health_check_url: ""
      internal_url: ""
      is_core: false
      project: "istio"
      url_format: ""
    prometheus:
      auth:
        insecure_skip_verify: false
        password: ""
        token: ""
        type: "none"
        use_kiali_token: false
        username: ""
      cache_duration: 7
      cache_enabled: true
      cache_expiration: 300
      # default: custom_headers is empty
      custom_headers:
        customHeader1: "customHeader1Value"
      health_check_url: ""
      is_core: true
      # default: query_scope is empty
      query_scope:
        mesh_id: "mesh-1"
        cluster: "cluster-east"
      thanos_proxy:
        enabled: false
        retention_period: "7d"
        scrape_interval: "30s"
      url: ""
    tracing:
      auth:
        insecure_skip_verify: false
        password: ""
        token: ""
        type: "none"
        use_kiali_token: false
        username: ""
      # default: custom_headers is empty
      custom_headers:
        customHeader1: "customHeader1Value"
      disable_version_check: false
      enabled: false
      external_url: ""
      grpc_port: 9095
      health_check_url: ""
      internal_url: ""
      is_core: false
      namespace_selector: true
      provider: "jaeger"
      # default: query_scope is empty
      query_scope:
        mesh_id: "mesh-1"
        cluster: "cluster-east"
      query_timeout: 5
      tempo_config:
        cache_capacity: 200
        cache_enabled: true
        datasource_uid: ""
        name: ""
        namespace: ""
        org_id: ""
        tenant: ""
        url_format: "grafana"
      use_grpc: true
      use_waypoint_name: false
      whitelist_istio_system: ["jaeger-query", "istio-ingressgateway"]

  health_config:
    compute:
      duration: "5m"
      refresh_interval: "3m"
      timeout: "10m"
    # default: rate is an empty list
    rate:
    - namespace: ".*"
      kind: ".*"
      name: ".*"
      tolerance:
      - protocol: "http"
        direction: ".*"
        code: "[1234]00"
        degraded: 5
        failure: 10

  identity:
    # default: cert_file is undefined
    cert_file: ""
    # default: private_key_file is undefined
    private_key_file: ""

  istio_labels:
    app_label_name: ""
    egress_gateway_label: "istio=egressgateway"
    ingress_gateway_label: "istio=ingressgateway"
    injection_label_name: "istio-injection"
    injection_label_rev: "istio.io/rev"
    version_label_name: ""

  kiali_feature_flags:
    clustering:
      enable_exec_provider: false
    # default: custom_workload_types is an empty list
    custom_workload_types:
    - group: "argoproj.io"
      version: "v1alpha1"
      kind: "Rollout"
    disabled_features: []
    istio_annotation_action: true
    istio_injection_action: true
    istio_upgrade_action: false
    ui_defaults:
      graph:
        find_options:
        - description: "Find: slow edges (> 1s)"
          expression: "rt > 1000"
        - description: "Find: unhealthy nodes"
          expression: "! healthy"
        - description: "Find: unknown nodes"
          expression: "name = unknown"
        hide_options:
        - description: "Hide: healthy nodes"
          expression: "healthy"
        - description: "Hide: unknown nodes"
          expression: "name = unknown"
        settings:
          animation: "point"
        traffic:
          ambient: "total"
          grpc: "requests"
          http: "requests"
          tcp: "sent"
      i18n:
        language: "en"
        show_selector: false
      list:
        include_health: true
        include_istio_resources: true
        include_validations: true
        show_include_toggles: false
      mesh:
        find_options:
        - description: "Find: unhealthy nodes"
          expression: "! healthy"
        hide_options:
        - description: "Hide: healthy nodes"
          expression: "healthy"
      # default: metrics_inbound is undefined
      metrics_inbound:
        aggregations:
        - display_name: "Istio Network"
          label: "topology_istio_io_network"
          single_selection: false
        - display_name: "Istio Revision"
          label: "istio_io_rev"
          single_selection: false
      # default: metrics_outbound is undefined
      metrics_outbound:
        aggregations:
        - display_name: "Istio Network"
          label: "topology_istio_io_network"
          single_selection: false
        - display_name: "Istio Revision"
          label: "istio_io_rev"
          single_selection: false
      metrics_per_refresh: "1m"
      # default: namespaces is an empty list
      namespaces: ["istio-system"]
      refresh_interval: "1m"
      tracing:
        limit: 100
    validations:
      ignore: ["KIA1301"]
      skip_wildcard_gateway_hosts: false

  kubernetes_config:
    burst: 200
    cache_duration: 300
    cache_token_namespace_duration: 10
    excluded_workloads:
    - "CronJob"
    - "DeploymentConfig"
    - "Job"
    - "ReplicationController"
    qps: 175

  login_token:
    expiration_seconds: 86400
    signing_key: ""

  server:
    address: ""
    audit_log: true
    cors_allow_all: false
    gzip_enabled: true
    # default: node_port is undefined
    node_port: 32475
    observability:
      metrics:
        enabled: true
        health_status:
          enabled: false
          max_consecutive_na: 3
        port: 9090
      tracing:
        collector_type: "otel"
        collector_url: "jaeger-collector.istio-system:4318"
        enabled: false
        otel:
          ca_name: ""
          protocol: "http"
          skip_verify: false
          tls_enabled: false
        sampling_rate: 0.5
    port: 20001
    profiler:
      enabled: false
    require_auth: false
    web_fqdn: ""
    web_history_mode: "browser"
    web_port: ""
    web_root: ""
    web_schema: ""
    write_timeout: "60s"
Validating your Kiali CR
The Kiali CR has a CRD Schema so it will be validated when you create or update it in your cluster.
Properties
(object)
This is the CRD for the resources called Kiali CRs. The Kiali Operator will watch for resources of this type and when it detects a Kiali CR has been added, deleted, or modified, it will install, uninstall, and update the associated Kiali Server installation. The settings here will configure the Kiali Server as well as the Kiali Operator. All of these settings will be stored in the Kiali ConfigMap. Do not modify the ConfigMap; it will be managed by the Kiali Operator. Only modify the Kiali CR when you want to change a configuration setting.
(array)
A list of additional details that Kiali will look for in annotations. When found on any workload or service, Kiali will display the additional details in the respective workload or service details page. This is typically used to inject some CI metadata or documentation links into Kiali views. For example, by default, Kiali will recognize these annotations on a service or workload (e.g. a Deployment, StatefulSet, etc.):
spec:
  annotations:
    kiali.io/api-spec: http://list/to/my/api/doc
    kiali.io/api-type: rest
Note that if you change this setting for your own custom annotations, keep in mind that it would override the current default. So you would have to add the default setting as shown in the example CR if you want to preserve the default links.
(string)
*Required*
The name of the annotation whose value is a URL to additional documentation useful to the user.
(string)
The name of the annotation whose value is used to determine what icon to display. The annotation name itself can be anything, but note that the value of that annotation must be one of: rest, grpc, and graphql - any other value is ignored.
(string)
*Required*
The title of the link that Kiali will display. The link will go to the URL specified in the value of the configured annotation.
(object)
DEPRECATED AFTER v1.73: These settings control how the Kiali API should be accessed.
(object)
DEPRECATED AFTER v1.73: Settings for the API namespaces feature.
(array)
DEPRECATED AFTER v1.73: A list of namespace names that will be excluded from Kiali API.
(array)
DEPRECATED AFTER v1.73: A list of namespace names that will be included in Kiali API.
(string)
DEPRECATED AFTER v1.73: A Kubernetes label selector expression that will be used to exclude namespaces.
(string)
DEPRECATED AFTER v1.73: A Kubernetes label selector expression that will be used to include namespaces.
(string)
DEPRECATED since v2.21: Use auth.openid.discovery_override.authorization_endpoint instead. The URL of the provider’s authorization endpoint.
(object)
Optional configuration to override OpenID Connect auto-discovery. Use when the IdP restricts access to /.well-known/openid-configuration endpoint.
(string)
The URL of the provider’s authorization endpoint.
(string)
The URL of the provider’s JWK Set document.
(string)
The URL of the provider’s token endpoint.
(string)
The URL of the provider’s UserInfo endpoint.
(integer)
DEPRECATED AFTER v1.73: The amount of time in seconds Kiali will wait for a response from the OpenShift API when requesting authentication information.
(string)
DEPRECATED AFTER v1.73: A prefix that will be applied to the OpenShift OAuth client identifier.
(boolean)
Set true to skip verifying certificate validity when Kiali contacts OpenShift over https.
(array)
Custom redirect URIs for the OpenShift OAuth client. These URIs specify where users will be redirected after successful authentication. If not specified, Kiali will automatically generate appropriate redirect URIs based on the Kiali server’s route. You normally do not have to set this unless you are creating remote cluster resources (see deployment.remote_cluster_resources_only) with auth.strategy set to openshift.
(integer)
Sets the maximum time in seconds that can elapse between consecutive uses of an OAuth access token before it expires due to inactivity. This helps improve security by automatically expiring unused tokens. If set to 0, tokens will not expire due to inactivity. Note that OpenShift may enforce minimum values for this setting, and existing tokens are not affected by changes to this configuration.
(integer)
Sets the absolute maximum lifetime in seconds for OAuth access tokens, regardless of activity. After this time period, tokens will expire and users must re-authenticate. If set to 0, tokens will not have an absolute expiration time and will only expire due to inactivity (if token_inactivity_timeout is configured).
(string)
Determines what authentication strategy to use when users log into Kiali.
Options are anonymous, token, openshift, openid, or header.
- Choose
anonymous to allow full access to Kiali without requiring any credentials.
- Choose
token to allow access to Kiali using service account tokens, which controls
access based on RBAC roles assigned to the service account.
- Choose
openshift to use the OpenShift OAuth login which controls access based on
the individual’s RBAC roles in OpenShift. Not valid for non-OpenShift environments.
- Choose
openid to enable OpenID Connect-based authentication. Your cluster is required to
be configured to accept the tokens issued by your IdP. There are additional required
configurations for this strategy. See below for the additional OpenID configuration section.
- Choose
header when Kiali is running behind a reverse proxy that will inject an
Authorization header and potentially impersonation headers.
When empty, this value will default to openshift on OpenShift and token on other Kubernetes environments.
(string)
The default provider to use for the ChatAI feature. This is the provider that will be used if no provider is specified in the request.
(boolean)
Enable or disable the ChatAI feature.
(array)
A list of providers that can be used for the ChatAI feature. This is the list of providers that will be available to the user to choose from.
(string)
The type of the config needed by the AI models provider. Available values are default, gemini, and azure. Default value is default.
(string)
The default model of the provider.
(string)
The description of the provider.
(boolean)
Enable or disable the provider.
(string)
The key of the provider. May refer to a secret using the pattern secret:<secretName>:<secretKey>. When using a secret, the token is cached and automatically refreshed when the secret changes, enabling rotation without pod restart.
(array)
A list of models that can be used for the ChatAI feature. This is the list of models that will be available to the user to choose from.
(string)
The description of the model.
(boolean)
Enable or disable the model.
(string)
The endpoint of the model.
(string)
The key of the model. May refer to a secret using the pattern secret:<secretName>:<secretKey>. When using a secret, the token is cached and automatically refreshed when the secret changes, enabling rotation without pod restart.
(string)
The name of the provider.
(string)
The type of the AI models provider. Available values are openai. Default value is openai.
(object)
Configuration for the ChatAI store.
(boolean)
Enable or disable the ChatAI store.
(integer)
The maximum cache memory for the ChatAI store.
(integer)
The threshold for the ChatAI store reduction with AI. This is the number of messages in a conversation before the conversation is reduced.
(boolean)
Enable or disable the ChatAI store reduction with AI.
(object)
Multi-cluster related features.
(object)
Settings to allow cluster secrets to be auto-detected. Secrets must exist in the Kiali deployment namespace.
(boolean)
If true then remote cluster secrets will be autodetected during the installation of the Kiali Server Deployment. Any remote cluster secrets found in the Kiali deployment namespace will be mounted to the Kiali Server’s file system. If false, you can still manually specify the remote cluster secret information in the ‘clusters’ setting if you wish to utilize multicluster features.
(string)
The name and value of a label that exists on all remote cluster secrets.
(array)
A list of clusters that the Kiali Server can access. You need to specify the remote clusters here if ‘autodetect_secrets.enabled’ is false.
(string)
The name of the secret that contains the credentials necessary to connect to the remote cluster. This secret must exist in the Kiali deployment namespace. If a secret name is not provided then it’s assumed that the cluster is inaccessible.
(boolean)
Flag to enable exec provider for clustering authentication.
(boolean)
Set to true for an external Kiali deployment, or if Kiali should not try to discover Istio on the home cluster. When set to true, it is required to set kubernetes_config.cluster_name.
(array)
A map between cluster name, instance name and namespace to a Kiali URL. Will be used showing the Mesh page’s Kiali URLs. The Kiali service’s ‘kiali.io/external-url’ annotation will be overridden when this property is set.
(string)
The instance name of this Kiali installation. This should be the value used in deployment.instance_name for Kiali resource name.
(string)
The namespace into which Kiali is installed.
(string)
The URL of Kiali in the cluster.
(array)
A list of user-defined custom monitoring dashboards that you can use to generate metrics charts
for your applications. The server has some built-in dashboards; if you define a custom dashboard here
with the same name as a built-in dashboard, your custom dashboard takes precedence and will overwrite
the built-in dashboard. You can disable one or more of the built-in dashboards by simply defining an
empty dashboard.
An example of an additional user-defined dashboard,
spec:
  custom_dashboards:
  - name: myapp
    title: My App Metrics
    items:
    - chart:
        name: "Thread Count"
        spans: 4
        metricName: "thread-count"
        dataType: "raw"
An example of disabling a built-in dashboard (in this case, disabling the Envoy dashboard),
spec:
  custom_dashboards:
  - name: envoy
To learn more about custom monitoring dashboards, see the documentation at https://kiali.io/docs/configuration/custom-dashboard/
(array)
DEPRECATED AFTER v1.73: A list of namespaces Kiali is allowed to access. This replaces discovery selectors.
(array)
Additional containers to add to the list of pod containers. Use this to add container(s) to the Kiali pod. SECURITY: By default, the operator will forcibly apply a restrictive security context to all containers (allowPrivilegeEscalation: false, privileged: false, readOnlyRootFilesystem: true, runAsNonRoot: true, capabilities dropped). However, if the operator’s ALLOW_SECURITY_CONTEXT_OVERRIDE environment variable is set to ‘true’, containers can define their own security contexts which will be preserved. Secret-backed volumes are automatically forced to read-only regardless of the security context override setting. Use with care since containers may cause the Kiali container itself to operate incorrectly. It is up to the user who added the additional containers to ensure it works properly inside the Kiali pod; Kiali makes no guarantee additional containers will work.
(array)
Additional initContainers to add to the list of pod initContainers. Use this to add initContainer(s) to the Kiali pod. SECURITY: By default, the operator will forcibly apply a restrictive security context to all initContainers (allowPrivilegeEscalation: false, privileged: false, readOnlyRootFilesystem: true, runAsNonRoot: true, capabilities dropped). However, if the operator’s ALLOW_SECURITY_CONTEXT_OVERRIDE environment variable is set to ‘true’, initContainers can define their own security contexts which will be preserved. Secret-backed volumes are automatically forced to read-only regardless of the security context override setting. Use with care since initContainers may cause the Kiali container itself to operate incorrectly. It is up to the user who added the additional initContainers to ensure it works properly inside the Kiali pod; Kiali makes no guarantee additional initContainers will work.
(object)
Additional custom yaml to add to the service definition. This is used mainly to customize the service type. For example, if the deployment.service_type is set to ‘LoadBalancer’ and you want to set the loadBalancerIP, you can do so here with: additional_service_yaml: { 'loadBalancerIP': '78.11.24.19' }. Another example would be if the deployment.service_type is set to ‘ExternalName’ you will need to configure the name via: additional_service_yaml: { 'externalName': 'my.kiali.example.com' }. A final example would be if external IPs need to be set: additional_service_yaml: { 'externalIPs': ['80.11.12.10'] }
(object)
Affinity definitions that are to be used to define the nodes where the Kiali pod should be constrained. See the Kubernetes documentation on Assigning Pods to Nodes for the proper syntax for these three different affinity types.
(boolean)
Determines if the Kiali server will be granted cluster-wide permissions to see all namespaces. When true, this provides more efficient caching within the Kiali server. It must be true if deployment.discovery_selectors.default is left unset. To limit the namespaces for which Kiali has permissions, set to false and define the desired selectors in deployment.discovery_selectors.default.
(object)
Custom annotations to be created on the Kiali ConfigMap.
(array)
Defines additional environment variables to be set in the Kiali server pod. This is typically used for (but not limited to) setting proxy environment variables such as HTTP_PROXY, HTTPS_PROXY, and/or NO_PROXY.
(string)
*Required*
The name of the custom environment variable.
(string)
*Required*
The value of the custom environment variable.
(array)
Defines additional secrets that are to be mounted in the Kiali pod.
These are useful to contain client certificates that are used by Kiali to authenticate to third party systems
using mTLS (for example, see external_services.tracing.auth.cert_file and external_services.tracing.auth.key_file).
These secrets must be created by an external mechanism. Kiali will not generate these secrets; it
is assumed these secrets are externally managed. You can define 0, 1, or more secrets.
An example configuration is,
spec:
  deployment:
    custom_secrets:
    - name: mysecret
      mount: /mysecret-path
    - name: my-other-secret
      mount: /my-other-secret-location
      optional: true
(string)
*Required*
The file path location where the secret content will be mounted. The custom secret cannot be mounted on a path that the operator will use to mount its secrets. Make sure you set your custom secret mount path to a unique, unused path. Paths such as /kiali-configuration, /kiali-cert, /kiali-cabundle, /kiali-secret, /kiali-override-secrets, and /kiali-remote-cluster-secrets should not be used as mount paths for custom secrets because the operator may want to use one of those paths.
(string)
*Required*
The name of the secret that is to be mounted to the Kiali pod’s file system. The name of the custom secret must not be the same name as one created by the operator. Names such as kiali, kiali-cert-secret, and kiali-cabundle should not be used as a custom secret name because the operator may want to create one with one of those names.
(boolean)
Indicates if the secret may or may not exist at the time the Kiali pod starts. This is ignored if csi is specified - CSI secrets must exist when specified.
(array)
These are label selectors for the Kiali local cluster and for all remote clusters that do not have overrides.
Namespaces that match these selectors are visible to Kiali users.
When cluster_wide_access=false these default selectors are used to restrict which namespaces Kiali will have access to.
If there are no default discovery selectors, then cluster_wide_access should be true in which case Kiali will have
permissions to access all namespaces.
(object)
If a remote cluster has different namespaces than the local cluster, these overrides provide a way for you to match those remote namespaces. Kiali will make these remote namespaces visible to users. The name of the overrides section is the name of the remote cluster. Note that the default selectors are ignored when matching namespaces on a remote cluster if that remote cluster has overrides defined.
(object)
DNS configuration that is applied to the DNS policy. See the Kubernetes documentation for the different configuration settings that are supported.
(string)
DNS policy. See the Kubernetes documentation for the different policies that are supported.
(object)
Extra name/value pairs to be added to the labels of all resources created by the operator.
These are added to the labels the operator creates by default. These will not overwrite
labels that the operator creates itself. For example, if you set “app.kubernetes.io/name”
as an extra label, it will be silently ignored because that is one of the labels the operator
creates on all resources.
(object)
Determines what (if any) HorizontalPodAutoscaler should be created to autoscale the Kiali pod.
A typical way to configure HPA for Kiali is,
spec:
  deployment:
    hpa:
      api_version: "autoscaling/v2"
      spec:
        maxReplicas: 2
        minReplicas: 1
        metrics:
        - type: Resource
          resource:
            name: cpu
            target:
              type: Utilization
              averageUtilization: 50
(string)
A specific HPA API version that can be specified in case there is some HPA feature you want to use that is only supported in that specific version. If value is an empty string, an attempt will be made to determine a valid version.
(object)
The spec specified here will be placed in the created HPA resource’s ‘spec’ section. If spec is left empty, no HPA resource will be created. Note that you must not specify the ‘scaleTargetRef’ section in spec; the Kiali Operator will populate that for you.
(string)
If deployment.image_version is a digest hash, this value indicates what type of digest it is. A typical value would be ‘sha256’. Note: do NOT prefix this value with a ‘@’.
(string)
Determines which Kiali image to download and install. If you set this to a specific name (i.e. you do not leave it as the default empty string), you must make sure that image is supported by the operator. If empty, the operator will use a known supported image name based on which version was defined. Note that, as a security measure, a cluster admin may have configured the Kiali operator to ignore this setting. A cluster admin may do this to ensure the Kiali operator only installs a single, specific Kiali version, thus this setting may have no effect depending on how the operator itself was configured.
(string)
The Kubernetes pull policy for the Kiali deployment. This is overridden to be ‘Always’ if deployment.image_version is set to ‘latest’.
(array)
The names of the secrets to be used when container images are to be pulled.
(string)
Determines which version of Kiali to install.
Choose ‘lastrelease’ to use the last Kiali release.
Choose ‘latest’ to use the latest image (which may or may not be a released version of Kiali).
Choose ‘operator_version’ to use the image whose version is the same as the operator version.
Otherwise, you can set this to any valid Kiali version (such as ‘v1.0’) or any valid Kiali
digest hash (if you set this to a digest hash, you must indicate the digest in deployment.image_digest).
Note that if this is set to ‘latest’ then the deployment.image_pull_policy will be set to ‘Always’.
If you set this to a specific version (i.e. you do not leave it as the default empty string),
you must make sure that image is supported by the operator.
If empty, the operator will use a known supported image version based on which ‘version’ was defined.
Note that, as a security measure, a cluster admin may have configured the Kiali operator to
ignore this setting. A cluster admin may do this to ensure the Kiali operator only installs
a single, specific Kiali version, thus this setting may have no effect depending on how the
operator itself was configured.
(object)
Configures if/how the Kiali endpoint should be exposed externally.
(object)
Additional labels to add to the Ingress (or Route if on OpenShift). These are added to the labels that are created by default; these do not override the default labels.
(string)
If class_name is a non-empty string, it will be used as the ‘spec.ingressClassName’ in the created Kubernetes Ingress resource. This setting is ignored if on OpenShift. This is also ignored if override_yaml.spec is defined (i.e. you must define the ‘ingressClassName’ directly in your override yaml).
(boolean)
Determines if the Kiali endpoint should be exposed externally. If ‘true’, an Ingress will be created if on Kubernetes or a Route if on OpenShift. If left undefined, this will be ‘false’ on Kubernetes and ‘true’ on OpenShift.
(object)
Because an Ingress into a cluster can vary wildly in its desired configuration,
this setting provides a way to override complete portions of the Ingress resource
configuration (Ingress on Kubernetes and Route on OpenShift). It is up to the user
to ensure this override YAML configuration is valid and supports the cluster environment
since the operator will blindly copy this custom configuration into the resource it
creates.
This setting is not used if deployment.ingress.enabled is set to ‘false’.
Note that only ‘metadata.annotations’ and ‘spec’ is valid and only they will
be used to override those same sections in the created resource. You can define
either one or both.
Note that override_yaml.metadata.labels is not allowed - you cannot override the labels; to add
labels to the default set of labels, use the deployment.ingress.additional_labels setting.
Example,
spec:
  deployment:
    ingress:
      override_yaml:
        metadata:
          annotations:
            nginx.ingress.kubernetes.io/secure-backends: "true"
            nginx.ingress.kubernetes.io/backend-protocol: "HTTPS"
        spec:
          rules:
          - http:
              paths:
              - path: /kiali
                pathType: Prefix
                backend:
                  service
                    name: "kiali"
                    port:
                      number: 20001
(string)
The instance name of this Kiali installation. This instance name will be the prefix prepended to the names of all Kiali resources created by the operator and will be used to label those resources as belonging to this Kiali installation instance. You cannot change this instance name after a Kiali CR is created. If you attempt to change it, the operator will abort with an error. If you want to change it, you must first delete the original Kiali CR and create a new one. Note that this does not affect the name of the auto-generated signing key secret. If you do not supply a signing key, the operator will create one for you in a secret, but that secret will always be named ‘kiali-signing-key’ and shared across all Kiali instances in the same deployment namespace. If you want a different signing key secret, you are free to create your own and tell the operator about it via login_token.signing_key. See the docs on that setting for more details. Note also that if you are setting this value, you may also want to change the installation_tag setting, but this is not required.
(object)
Configures the logger that emits messages to the Kiali server pod logs.
(string)
Indicates if the logs should be written with one log message per line or using a JSON format. Must be one of: text or json.
(string)
The lowest priority of messages to log. Must be one of: trace, debug, info, warn, error, or fatal.
(string)
With this setting every sampler_rate-th message will be logged. By default, every message is logged. As an example, setting this to '2' means every other message will be logged. The value of this setting is a string but must be parsable as an integer.
(string)
The namespace into which Kiali is to be installed. If this is empty or not defined, the default will be the namespace where the Kiali CR is located.
(object)
Configures if the Kiali server pod should be protected by a NetworkPolicy resource that restricts both ingress and egress traffic.
(boolean)
If true, a NetworkPolicy resource is created to restrict traffic to the Kiali server pod. The NetworkPolicy will allow ingress traffic only to the Kiali server API port and, if enabled, the metrics port.
(object)
A set of node labels that dictate onto which node the Kiali pod will be deployed.
(object)
Custom annotations to be created on the Kiali pod.
By default, the following annotation is applied:
proxy.istio.io/config: '{ "holdApplicationUntilProxyStarts": true }'
If you define your own pod_annotations, they will overwrite this default.
To retain the default behavior while adding your own annotations,
make sure to include this value alongside your custom annotations.
(object)
Custom labels to be created on the Kiali pod.
An example use for this setting is to inject an Istio sidecar such as,
sidecar.istio.io/inject: "true"
(string)
The priorityClassName used to assign the priority of the Kiali pod.
(object)
Configures the liveness, readiness, and startup probes of the Kiali pod.
(object)
Configures the liveness probe of the Kiali pod.
(object)
Configures the readiness probe of the Kiali pod.
(object)
Configures the startup probe of the Kiali pod.
(boolean)
When true, only those resources necessary for a remote Kiali Server to access this cluster are created (such as the service account and roles/bindings). There will be no Kiali Server deployment/pod created when this is true.
(integer)
The replica count for the Kiail deployment. If deployment.hpa is specified, this setting is ignored.
(object)
Defines compute resources that are to be given to the Kiali pod’s container. The value is a dict as defined by Kubernetes. See the Kubernetes documentation (https://kubernetes.io/docs/concepts/configuration/manage-compute-resources-container).
If you set this to an empty dict ({}) then no resources will be defined in the Deployment.
If you do not set this at all, the default is,
spec:
  deployment:
    resources:
      requests:
        cpu: "10m"
        memory: "64Mi"
      limits:
        memory: "1Gi"
(object)
Custom security context to be placed on the server container. The entire security context on the container will be the value of this setting if the operator is configured to allow it. Note that, as a security measure, a cluster admin may have configured the Kiali operator to not allow portions of this override setting - in this case you can specify additional security context settings but you cannot replace existing, default ones.
(object)
Custom annotations to be created on the Kiali Service resource.
(string)
The Kiali service type. Kubernetes determines what values are valid. Common values are ‘NodePort’, ‘ClusterIP’, and ‘LoadBalancer’.
(object)
Configures the update strategy for the Kiali deployment. If not specified, a RollingUpdate strategy is used with maxSurge=1 and maxUnavailable=1. See the Kubernetes documentation on Deployment Strategy for details.
(object)
TLS policy configuration. When source is ‘auto’ on OpenShift, the APIServer TLSSecurityProfile is used. Otherwise, the explicit config values are enforced.
(array)
Explicit TLS cipher suites (OpenSSL names). Ignored for TLS 1.3.
(string)
Maximum TLS version (e.g., TLSv1.3, TLSv1.2).
(string)
Minimum TLS version (e.g., TLSv1.3, TLSv1.2).
(string)
TLS policy source: ‘auto’ to use OpenShift TLSSecurityProfile; ‘config’ to use explicit settings.
(array)
A list of tolerations which declare which node taints Kiali can tolerate. See the Kubernetes documentation on Taints and Tolerations for more details.
(array)
A list of constraints which control how the Kiali pods are spread across your cluster to help achieve high availability as well as efficient resource utilization. See the Kubernetes documentation on Topology Spread Constraints for more details.
(boolean)
DEPRECATED AFTER v1.73: When true, Kiali will log additional debug information about its operations.
(string)
Kiali resources will be assigned a ‘version’ label when they are deployed.
This setting determines what value those ‘version’ labels will have.
When empty, its default will be determined as follows,
- If
deployment.image_version is ‘latest’, version_label will be fixed to ‘master’.
- If
deployment.image_version is ‘lastrelease’, version_label will be fixed to the last Kiali release version string.
- If
deployment.image_version is anything else, version_label will be that value, too.
(boolean)
When true, Kiali will be in ‘view only’ mode, allowing the user to view and retrieve management and monitoring data for the service mesh, but not allow the user to modify the service mesh.
(array)
Defines third-party extensions whose metrics can be integrated into the Kiali traffic graph.
(boolean)
Determines if the Kiali traffic graph should incorporate the extension’s metrics.
(string)
The name that is used to identify the metric time series for the extension.
(object)
These external service configuration settings define how to connect to the external services
like Prometheus, Grafana, and Jaeger.
Regarding sensitive values in the external_services ‘auth’ sections:
Some external services configured below support an ‘auth’ sub-section in order to tell Kiali
how it should authenticate with the external services. Credentials used to authenticate Kiali
to those external services can be defined in the auth.password and auth.token values
within the auth sub-section. Because these are sensitive values, you may not want to declare
the actual credentials here in the Kiali CR. In this case, you may store the actual password
or token string in a Kubernetes secret. If you do, you need to set the auth.password or
auth.token to a value in the format secret:<secretName>:<secretKey> where <secretName>
is the name of the secret object that Kiali can access, and <secretKey> is the name of the
key within the named secret that contains the actual password or token string. For example,
if Grafana requires a password, you can store that password in a secret named ‘myGrafanaCredentials’
in a key named ‘myGrafanaPw’. In this case, you would set external_services.grafana.auth.password
to secret:myGrafanaCredentials:myGrafanaPw.
(object)
Settings for enabling and discovering custom dashboards.
(integer)
Threshold of the number of pods, for a given Application or Workload, above which dashboards discovery will be skipped. This setting only takes effect when discovery_enabled is set to ‘auto’.
(string)
Enable, disable or set ‘auto’ mode to the dashboards discovery process. If set to ‘true’, Kiali will always try to discover dashboards based on metrics. Note that this can generate performance penalties while discovering dashboards for workloads having many pods (thus many metrics). When set to ‘auto’, Kiali will skip dashboards discovery for workloads with more than a configured threshold of pods (see discovery_auto_threshold). When discovery is disabled or auto/skipped, it is still possible to tie workloads with dashboards through annotations on pods (refer to the doc https://kiali.io/docs/configuration/custom-dashboard/#pod-annotations). Value must be a string and be one of: true, false, auto.
(boolean)
Enable or disable custom dashboards, including the dashboards discovery process.
(boolean)
Used in the Components health feature. When true, the unhealthy scenarios will be raised as errors. Otherwise, they will be raised as a warning.
(string)
The Prometheus label name used for identifying namespaces in metrics for custom dashboards. The default is namespace but you may want to use kubernetes_namespace depending on your Prometheus configuration.
(object)
The Prometheus configuration defined here refers to the Prometheus instance that is dedicated to fetching metrics for custom dashboards. This means you can obtain these metrics for the custom dashboards from a Prometheus instance that is different from the one that Istio uses. If this section is omitted, the same Prometheus that is used to obtain the Istio metrics will also be used for retrieving custom dashboard metrics.
(object)
Settings used to authenticate with the Prometheus instance.
(string)
DEPRECATED since v2.20: This setting is deprecated and will be ignored. To configure custom CA certificates, use the kiali-cabundle ConfigMap instead. See the TLS Configuration documentation for details.
(string)
The client certificate file to use when accessing Prometheus using https with mTLS. An empty string means no client certificate is used. May refer to a secret using the pattern secret:<secretName>:<secretKey>. When using a secret, the certificate is cached and automatically refreshed when the secret changes, enabling rotation without pod restart.
(boolean)
Set true to skip verifying certificate validity when Kiali contacts Prometheus over https.
(string)
The client private key file to use when accessing Prometheus using https with mTLS. An empty string means no client private key is used. May refer to a secret using the pattern secret:<secretName>:<secretKey>. When using a secret, the key is cached and automatically refreshed when the secret changes, enabling rotation without pod restart.
(string)
Password to be used when making requests to Prometheus, for basic authentication. May refer to a secret using the pattern secret:<secretName>:<secretKey>. When using a secret, the password is cached and automatically refreshed when the secret changes, enabling rotation without pod restart.
(string)
Token / API key to access Prometheus, for token-based authentication. May refer to a secret using the pattern secret:<secretName>:<secretKey>. When using a secret, the token is cached and automatically refreshed when the secret changes, enabling rotation without pod restart.
(string)
The type of authentication to use when contacting the server. Use bearer to send the token to the Prometheus server. Use basic to connect with username and password credentials. Use none to not use any authentication.
(boolean)
When true and if auth.type is bearer, Kiali Service Account token will be used for the API calls to Prometheus (in this case, auth.token config is ignored).
(string)
Username to be used when making requests to Prometheus with basic authentication. May refer to a secret using the pattern secret:<secretName>:<secretKey>. When using a secret, the username is cached and automatically refreshed when the secret changes, enabling rotation without pod restart.
(integer)
Prometheus caching duration expressed in seconds.
(boolean)
Enable/disable Prometheus caching used for Health services.
(integer)
Prometheus caching expiration expressed in seconds.
(object)
A set of name/value settings that will be passed as headers when requests are sent to Prometheus.
(string)
Used in the Components health feature. This is the url which Kiali will ping to determine whether the component is reachable or not. It defaults to url when not provided.
(boolean)
Used in the Components health feature. When true, the unhealthy scenarios will be raised as errors. Otherwise, they will be raised as a warning.
(object)
A set of labelName/labelValue settings applied to every Prometheus query. Used to narrow unified metrics to only those scoped to the Kiali instance.
(object)
Define this section if Prometheus is to be queried through a Thanos proxy. Kiali will still use the url setting to query for Prometheus metrics so make sure that is set appropriately.
(boolean)
Set to true when a Thanos proxy is in front of Prometheus.
(string)
Thanos Retention period value expressed as a string.
(string)
Thanos Scrape interval value expressed as a string.
(string)
The URL used to query the Prometheus Server. This URL must be accessible from the Kiali pod. If empty, the default will assume Prometheus is in the Istio control plane namespace; e.g. http://prometheus.istio-system:9090.
(object)
Configuration used to access the Grafana dashboards.
(object)
Settings used to authenticate with the Grafana instance.
(string)
DEPRECATED since v2.20: This setting is deprecated and will be ignored. To configure custom CA certificates, use the kiali-cabundle ConfigMap instead. See the TLS Configuration documentation for details.
(string)
The client certificate file to use when accessing Grafana using https with mTLS. An empty string means no client certificate is used. May refer to a secret using the pattern secret:<secretName>:<secretKey>. When using a secret, the certificate is cached and automatically refreshed when the secret changes, enabling rotation without pod restart.
(boolean)
Set true to skip verifying certificate validity when Kiali contacts Grafana over https.
(string)
The client private key file to use when accessing Grafana using https with mTLS. An empty string means no client private key is used. May refer to a secret using the pattern secret:<secretName>:<secretKey>. When using a secret, the key is cached and automatically refreshed when the secret changes, enabling rotation without pod restart.
(string)
Password to be used when making requests to Grafana, for basic authentication. May refer to a secret using the pattern secret:<secretName>:<secretKey>. When using a secret, the password is cached and automatically refreshed when the secret changes, enabling rotation without pod restart.
(string)
Token / API key to access Grafana, for token-based authentication. May refer to a secret using the pattern secret:<secretName>:<secretKey>. When using a secret, the token is cached and automatically refreshed when the secret changes, enabling rotation without pod restart.
(string)
The type of authentication to use when contacting the server. Use bearer to send the token to the Grafana server. Use basic to connect with username and password credentials. Use none to not use any authentication.
(boolean)
When true and if auth.type is bearer, Kiali Service Account token will be used for the API calls to Grafana (in this case, auth.token config is ignored).
(string)
Username to be used when making requests to Grafana with basic authentication. May refer to a secret using the pattern secret:<secretName>:<secretKey>. When using a secret, the username is cached and automatically refreshed when the secret changes, enabling rotation without pod restart.
(array)
A list of Grafana dashboards that Kiali can link to.
(string)
The name of the Grafana dashboard.
(string)
The name of a variable that holds the app name, if used in that dashboard (else it must be omitted).
(string)
The name of the variable that holds the Datasource UID, required if Grafana has multiple datasources configured (else it must be omitted).
(string)
The name of a variable that holds the namespace, if used in that dashboard (else it must be omitted).
(string)
The name of a variable that holds the service name, if used in that dashboard (else it must be omitted).
(string)
The name of a variable that holds the version, if used in that dashboard (else it must be omitted).
(string)
The name of a variable that holds the workload name, if used in that dashboard (else it must be omitted).
(string)
The UID of the Datasource configured in Grafana must be specified if multiple datasources are configured. It is empty by default and is used only in conjunction with the datasource variable.
(boolean)
When true, Grafana support will be enabled in Kiali.
(string)
The URL that the Kiali UI uses when displaying Grafana links to the user. This URL must be accessible to clients external to the cluster (e.g. a browser) in order for the integration to work properly. If empty, an attempt to auto-discover it is made. This URL can contain query parameters if needed, such as ‘?orgId=1’.
(string)
Used in the Components health feature. This is the URL which Kiali will ping to determine whether the component is reachable or not. It defaults to internal_url when not provided.
(string)
DEPRECATED AFTER v1.73: The URL used for in-cluster access to Grafana.
(string)
The URL used by Kiali to perform requests and queries to Grafana. An example would be http://grafana.istio-system:3000. This URL can contain query parameters if needed, such as ‘?orgId=1’. If not defined, it will default to http://grafana.<istio namespace>:3000.
(boolean)
Used in the Components health feature. When true, the unhealthy scenarios will be raised as errors. Otherwise, they will be raised as a warning.
(string)
DEPRECATED AFTER v1.73: The URL used to access Grafana from external sources.
(object)
Istio configuration that Kiali needs to know about in order to observe the mesh.
(object)
Istio components whose status will be monitored by Kiali.
(array)
A specific Istio component whose status will be monitored by Kiali.
(string)
Istio component pod app label.
(boolean)
Whether the component is to be considered a core component for your deployment.
(boolean)
Whether the component is a multi-cluster component.
(boolean)
Whether the component is a native Envoy proxy.
(string)
The namespace where the component is installed. It defaults to the Istio control plane namespace (e.g. istio-system). Note that the Istio documentation suggests you install the ingress and egress to different namespaces, so you most likely will want to explicitly set this namespace value for the ingress and egress components.
(boolean)
Determines if Istio component statuses will be displayed in the Kiali masthead indicator.
(string)
DEPRECATED AFTER v2.11: This setting is deprecated and will be ignored. The name of the istio control plane config map is now autodetected based on revision.
(string)
The namespace where Istio EgressGateway component is read for a status check. When left empty, the control plane namespace is used. e.g. istio-system.
(integer)
DEPRECATED AFTER v2.11: This setting is deprecated and will be ignored. The port which Kiali will open to fetch envoy config data information is now hardcoded to the standard Envoy port.
(string)
DEPRECATED AFTER v1.73: The name of the Gateway API Class used by Istio.
(array)
A list declaring all the Gateway API Classes used in Istio. If empty or undefined, Kiali attempts to auto-discover Gateway Classes if cluster_wide_access is set true for Kiali; otherwise, it defaults to istio, istio-remote, and adds istio-waypoint for Ambient mode or istio-east-west for multicluster setup.
(string)
The name of the GatewayClass.
(string)
The name of the Gateway API implementation.
(string)
Label selector for auto-discovering K8s Gateway API Classes. Used if gateway_api_classes is unset and cluster_wide_access is set true for Kiali. When left empty then all K8s Gateway API Classes will be loaded.
(boolean)
Indicates if Kiali has access to istiod.
(object)
DEPRECATED AFTER v2.11: This setting is deprecated and will be ignored. Canary upgrade/downgrade functionality now autodetects canary revisions from running istiod pods.
(string)
DEPRECATED AFTER v2.11: The currently installed Istio revision.
(string)
DEPRECATED AFTER v2.11: The installed Istio canary revision to upgrade to.
(string)
The Kubernetes cluster DNS domain suffix used to construct fully qualified service hostnames (e.g. reviews.bookinfo.svc.cluster.local) and service account identity strings for validation.
(string)
DEPRECATED AFTER v2.11: This setting is deprecated and will be ignored. The name of the field that annotates a workload to indicate a sidecar should be automatically injected by Istio is now hardcoded to the standard value.
(string)
DEPRECATED AFTER v2.11: This setting is deprecated and will be ignored. The pod annotation used by Istio to identify the sidecar is now hardcoded to the standard value.
(string)
DEPRECATED AFTER v2.11: This setting is deprecated and will be ignored. The name of the istio-sidecar-injector config map is now autodetected based on revision.
(string)
DEPRECATED AFTER v2.11: This setting is deprecated and will be ignored. The name of the istiod deployment is now autodetected.
(integer)
DEPRECATED AFTER v2.11: This setting is deprecated and will be ignored. The monitoring port of the IstioD pod is now autodetected from the deployment args.
(integer)
How often in seconds Kiali will poll istiod(s) for proxy status. Polling is not performed if istio_api_enabled is false.
(string)
DEPRECATED AFTER v2.11: This setting is deprecated and will be ignored. The namespace to treat as the administrative root namespace for Istio configuration.
(string)
DEPRECATED AFTER v2.11: This setting is deprecated and will be ignored. The Istio service used to determine the Istio version is now autodetected from services.
(boolean)
When true, Kiali will detect changes in Istio configuration and trigger validation reconciliation.
(string)
Configures how often Kiali will validate Istio configuration. Validations cannot be disabled at the moment but you can set this to a long period of time. Accepts a golang duration string e.g. ‘1h’ or ‘30m’.
(object)
Configuration used to access the Perses dashboards.
(object)
Settings used to authenticate with the Perses instance.
(string)
DEPRECATED since v2.20: This setting is deprecated and will be ignored. To configure custom CA certificates, use the kiali-cabundle ConfigMap instead. See the TLS Configuration documentation for details.
(string)
The client certificate file to use when accessing Perses using https with mTLS. An empty string means no client certificate is used. May refer to a secret using the pattern secret:<secretName>:<secretKey>. When using a secret, the certificate is cached and automatically refreshed when the secret changes, enabling rotation without pod restart.
(boolean)
Set true to skip verifying certificate validity when Kiali contacts Perses over https.
(string)
The client private key file to use when accessing Perses using https with mTLS. An empty string means no client private key is used. May refer to a secret using the pattern secret:<secretName>:<secretKey>. When using a secret, the key is cached and automatically refreshed when the secret changes, enabling rotation without pod restart.
(string)
Password to be used when making requests to Perses, for basic authentication. May refer to a secret using the pattern secret:<secretName>:<secretKey>. When using a secret, the password is cached and automatically refreshed when the secret changes, enabling rotation without pod restart.
(string)
The type of authentication to use when contacting the server. Use bearer to send the token to the Perses server. Use basic to connect with username and password credentials. Use none to not use any authentication.
(boolean)
When true and if auth.type is bearer, Kiali Service Account token will be used for the API calls to Perses.
(string)
Username to be used when making requests to Perses with basic authentication. May refer to a secret using the pattern secret:<secretName>:<secretKey>. When using a secret, the username is cached and automatically refreshed when the secret changes, enabling rotation without pod restart.
(array)
A list of Perses dashboards that Kiali can link to.
(string)
The name of the Perses dashboard.
(string)
The name of a variable that holds the app name, if used in that dashboard (else it must be omitted).
(string)
The name of the variable that holds the Datasource UID, required if Perses has multiple datasources configured (else it must be omitted).
(string)
The name of a variable that holds the namespace, if used in that dashboard (else it must be omitted).
(string)
The name of a variable that holds the service name, if used in that dashboard (else it must be omitted).
(string)
The name of a variable that holds the version, if used in that dashboard (else it must be omitted).
(string)
The name of a variable that holds the workload name, if used in that dashboard (else it must be omitted).
(boolean)
When true, Perses support will be enabled in Kiali.
(string)
The URL that the Kiali UI uses when displaying Perses links to the user. This URL must be accessible to clients external to the cluster (e.g. a browser) in order for the integration to work properly. If empty, an attempt to auto-discover it is made. This URL can contain query parameters if needed, such as ‘?orgId=1’.
(string)
Used in the Components health feature. This is the URL which Kiali will ping to determine whether the component is reachable or not. It defaults to internal_url when not provided.
(string)
The URL used by Kiali to perform requests and queries to Perses. An example would be http://perses.istio-system:4000. This URL can contain query parameters if needed, such as ‘?orgId=1’. If not defined, it will default to http://perses.<istio_namespace>:4000.
(boolean)
Used in the Components health feature. When true, the unhealthy scenarios will be raised as errors. Otherwise, they will be raised as a warning.
(string)
The name of the project where the Dashboards are defined.
(string)
The URL format. Leave empty (the default) for standard Perses upstream. Use openshift when using Perses Dashboards via the Cluster Observability operator in OpenShift.
(object)
The Prometheus configuration defined here refers to the Prometheus instance that is used by Istio to store its telemetry.
(object)
Settings used to authenticate with the Prometheus instance.
(string)
DEPRECATED since v2.20: This setting is deprecated and will be ignored. To configure custom CA certificates, use the kiali-cabundle ConfigMap instead. See the TLS Configuration documentation for details.
(string)
The client certificate file to use when accessing Prometheus using https with mTLS. An empty string means no client certificate is used. May refer to a secret.
(boolean)
Set true to skip verifying certificate validity when Kiali contacts Prometheus over https.
(string)
The client private key file to use when accessing Prometheus using https with mTLS. An empty string means no client private key is used. May refer to a secret using the pattern secret:<secretName>:<secretKey>. When using a secret, the key is cached and automatically refreshed when the secret changes, enabling rotation without pod restart.
(string)
Password to be used when making requests to Prometheus, for basic authentication. May refer to a secret using the pattern secret:<secretName>:<secretKey>. When using a secret, the password is cached and automatically refreshed when the secret changes, enabling rotation without pod restart.
(string)
Token / API key to access Prometheus, for token-based authentication. May refer to a secret using the pattern secret:<secretName>:<secretKey>. When using a secret, the token is cached and automatically refreshed when the secret changes, enabling rotation without pod restart.
(string)
The type of authentication to use when contacting the server. Use bearer to send the token to the Prometheus server. Use basic to connect with username and password credentials. Use none to not use any authentication (this is the default).
(boolean)
When true and if auth.type is bearer, Kiali Service Account token will be used for the API calls to Prometheus (in this case, auth.token config is ignored).
(string)
Username to be used when making requests to Prometheus with basic authentication. May refer to a secret using the pattern secret:<secretName>:<secretKey>. When using a secret, the username is cached and automatically refreshed when the secret changes, enabling rotation without pod restart.
(integer)
Prometheus caching duration expressed in seconds.
(boolean)
Enable/disable Prometheus caching used for Health services.
(integer)
Prometheus caching expiration expressed in seconds.
(object)
A set of name/value settings that will be passed as headers when requests are sent to Prometheus.
(string)
Used in the Components health feature. This is the url which Kiali will ping to determine whether the component is reachable or not. It defaults to url when not provided.
(boolean)
Used in the Components health feature. When true, the unhealthy scenarios will be raised as errors. Otherwise, they will be raised as a warning.
(object)
A set of labelName/labelValue settings applied to every Prometheus query. Used to narrow unified metrics to only those scoped to the Kiali instance.
(object)
Define this section if Prometheus is to be queried through a Thanos proxy. Kiali will still use the url setting to query for Prometheus metrics so make sure that is set appropriately.
(boolean)
Set to true when a Thanos proxy is in front of Prometheus.
(string)
Thanos Retention period value expressed as a string.
(string)
Thanos Scrape interval value expressed as a string.
(string)
The URL used to query the Prometheus Server. This URL must be accessible from the Kiali pod. If empty, the default will assume Prometheus is in the Istio control plane namespace; e.g. http://prometheus.istio-system:9090.
(object)
Configuration used to access the Tracing (Jaeger or Tempo) dashboards.
(object)
Settings used to authenticate with the Tracing server instance.
(string)
DEPRECATED since v2.20: This setting is deprecated and will be ignored. To configure custom CA certificates, use the kiali-cabundle ConfigMap instead. See the TLS Configuration documentation for details.
(string)
The client certificate file to use when accessing the Tracing server using https with mTLS. An empty string means no client certificate is used. May refer to a secret using the pattern secret:<secretName>:<secretKey>. When using a secret, the certificate is cached and automatically refreshed when the secret changes, enabling rotation without pod restart.
(boolean)
Set true to skip verifying certificate validity when Kiali contacts the Tracing server over https.
(string)
The client private key file to use when accessing the Tracing server using https with mTLS. An empty string means no client private key is used. May refer to a secret using the pattern secret:<secretName>:<secretKey>. When using a secret, the key is cached and automatically refreshed when the secret changes, enabling rotation without pod restart.
(string)
Password to be used when making requests to the Tracing server, for basic authentication. May refer to a secret using the pattern secret:<secretName>:<secretKey>. When using a secret, the password is cached and automatically refreshed when the secret changes, enabling rotation without pod restart.
(string)
Token / API key to access the Tracing server, for token-based authentication. May refer to a secret using the pattern secret:<secretName>:<secretKey>. When using a secret, the token is cached and automatically refreshed when the secret changes, enabling rotation without pod restart.
(string)
The type of authentication to use when contacting the server. Use bearer to send the token to the Tracing server. Use basic to connect with username and password credentials. Use none to not use any authentication (this is the default).
(boolean)
When true and if auth.type is bearer, Kiali Service Account token will be used for the API calls to the Tracing server (in this case, auth.token config is ignored).
(string)
Username to be used when making requests to the Tracing server with basic authentication. May refer to a secret using the pattern secret:<secretName>:<secretKey>. When using a secret, the username is cached and automatically refreshed when the secret changes, enabling rotation without pod restart.
(object)
A set of name/value settings that will be passed as headers when requests are sent to the Tracing backend.
(boolean)
When true, the version of the Tracing backend will not be retrieved. This will mean Kiali will not be able to display the version of your Tracing component in the Kiali UI. This may be needed in order to avoid Kiali reporting errors in cases where the full version endpoint is not accessible or is unknown. A common use case is when using Jaeger with gRPC and the HTTP endpoint is not deployed in the standard port (80).
(boolean)
When true, connections to the Tracing server are enabled. internal_url and/or external_url need to be provided.
(string)
The URL that the Kiali UI uses when displaying Tracing UI links to the user. This URL must be accessible to clients external to the cluster (e.g. a browser) in order to generate valid links. If the tracing service is deployed with a QUERY_BASE_PATH set, set this URL like https:///; for example, https://tracing-service:8080/jaeger
(integer)
Set port number when use_grpc is true and provider is tempo.
(string)
Used in the Components health feature. This is the url which Kiali will ping to determine whether the component is reachable or not. It defaults to url when not provided.
(string)
DEPRECATED AFTER v1.73: The URL used for in-cluster access to the tracing service.
(string)
The URL used by Kiali to perform requests and queries to the tracing backend which enables further integration between Kiali and the tracing server. When not provided, Kiali will only show external links using the external_url setting. Note: Jaeger v1.20+ has separated ports for GRPC(16685) and HTTP(16686) requests. Make sure you use the appropriate port according to the use_grpc value. Example: http://tracing.istio-system:16685
(boolean)
Used in the Components health feature. When true, the unhealthy scenarios will be raised as errors. Otherwise, they will be raised as a warning.
(boolean)
Kiali use this boolean to find traces with a namespace selector : service.namespace.
(string)
The trace provider to get the traces from. Value must be one of: jaeger or tempo.
(object)
A set of tagKey/tagValue settings applied to every Jaeger query. Used to narrow unified traces to only those scoped to the Kiali instance.
(integer)
The amount of time in seconds Kiali will wait for a response from ‘jaeger-query’ service when fetching traces.
(object)
Settings used to configure the access url to the Tempo Datasource in Grafana.
(integer)
When cache_enabled is true, the number of traces saved in the cache.
(boolean)
A FIFO cache with the last cache_capacity traces viewed.
(string)
The unique identifier (uid) of the Tempo datasource in Grafana.
(string)
The name of the Tempo instance for the url_format of openshift in the Plugin UI.
(string)
The namespace of the Tempo instance for the url_format of openshift in the Plugin UI.
(string)
The Id of the organization that the dashboard is in. Default to 1 (the first and default organization).
(string)
The name of the Tempo tenant for the url_format of openshift in the Plugin UI.
(string)
The URL format for the external url. Can be ‘jaeger’, ‘grafana’ or ‘openshift’. Default to ‘grafana’. Openshift will need the name, namespace and tenant in the tempo_config settings.
(string)
DEPRECATED AFTER v1.73: The URL used to access the tracing service from external sources.
(boolean)
Set to true in order to enable GRPC connections between Kiali and Jaeger which will speed up the queries. In some setups you might not be able to use GRPC (e.g. if Jaeger is behind some reverse proxy that doesn’t support it).
(boolean)
Set to true in order to look for traces using the waypoint service name and not the actual service. Ex. To find traces for Istio versions earlier than 1.28.
(array)
Kiali will get the traces of these services found in the Istio control plane namespace.
(string)
A name of a service found in the Istio control plane namespace whose traces will be retrieved by Kiali.
(object)
Configuration for health pre-computation and caching.
(string)
The time period over which health is calculated. Used as the rate interval for Prometheus queries. Minimum is ‘1m’.
(string)
The interval between health cache refreshes.
(string)
The maximum time allowed for a single health refresh cycle. If exceeded, the refresh is cancelled and the next cycle starts on schedule.
(string)
The type of resource that this configuration applies to. This is a regular expression.
(string)
The name of a resource that this configuration applies to. This is a regular expression.
(string)
The name of the namespace that this configuration applies to. This is a regular expression.
(array)
A list of tolerances for this configuration.
(string)
The status code that applies for this tolerance. This is a regular expression.
(integer)
Health will be considered degraded when the telemetry reaches this value (specified as an integer representing a percentage).
(string)
The direction that applies for this tolerance (e.g. inbound or outbound). This is a regular expression.
(integer)
A failure status will be shown when the telemetry reaches this value (specified as an integer representing a percentage).
(string)
The protocol that applies for this tolerance (e.g. grpc or http). This is a regular expression.
(object)
Settings that define the Kiali server identity.
(string)
Certificate file used to identify the Kiali server. If set, you must go over https to access Kiali. The Kiali operator will set this if it deploys Kiali behind https. When left undefined, the operator will attempt to generate a cluster-specific cert file that provides https by default (today, this auto-generation of a cluster-specific cert is only supported on OpenShift). When set to an empty string, https will be disabled.
(string)
Private key file used to identify the Kiali server. If set, you must go over https to access Kiali. When left undefined, the Kiali operator will attempt to generate a cluster-specific private key file that provides https by default (today, this auto-generation of a cluster-specific private key is only supported on OpenShift). When set to an empty string, https will be disabled.
(string)
Tag used to identify a particular instance/installation of the Kiali server. This is merely a human-readable string that will be used within Kiali to help a user identify the Kiali being used (e.g. in the Kiali UI title bar). See deployment.instance_name for the setting used to customize Kiali resource names that are created.
(object)
Defines specific labels used by Istio that Kiali needs to know about.
(string)
If using a single scheme for app/version labeling, set this to the app label name being used. This is typically app or app.kubernetes.io/name. The default is unset, and Kiali will handle mixed schemes.
(string)
The selector label for Egress Gateway workload. This is typically istio=egressgateway.
(string)
The selector label for Ingress Gateway workload. This is typically istio=ingressgateway.
(string)
The name of the label used to instruct Istio to automatically inject sidecar proxies when applications are deployed.
(string)
The label used to identify the Istio revision.
(string)
If using a single scheme for app/version labeling, set this to the version label name being used. This is typically version or app.kubernetes.io/version. The default is unset, and Kiali will handle mixed schemes.
(string)
DEPRECATED AFTER v2.11: This setting is deprecated and will be ignored. The namespace where Istio is installed is now autodetected. If left empty, it was previously assumed to be the same namespace as where Kiali is installed (i.e. deployment.namespace).
(object)
Kiali features that can be enabled or disabled.
(object)
DEPRECATED AFTER v1.73: Settings for certificate information indicators.
(boolean)
DEPRECATED AFTER v1.73: When true, certificate information indicators will be displayed.
(array)
DEPRECATED AFTER v1.73: List of secrets that contain certificate information.
(object)
DEPRECATED AFTER v1.73: Multi-cluster related features.
(object)
DEPRECATED AFTER v1.73: Settings to allow cluster secrets to be auto-detected.
(boolean)
DEPRECATED AFTER v1.73: If true then remote cluster secrets will be autodetected.
(string)
DEPRECATED AFTER v1.73: The name and value of a label that exists on all remote cluster secrets.
(array)
DEPRECATED AFTER v1.73: A list of clusters that the Kiali Server can access.
(string)
DEPRECATED AFTER v1.73: The name of the cluster.
(string)
DEPRECATED AFTER v1.73: The name of the secret that contains the credentials necessary to connect to the remote cluster.
(boolean)
DEPRECATED AFTER v1.73: Flag to enable exec provider for clustering authentication.
(array)
DEPRECATED AFTER v1.73: A map between cluster name, instance name and namespace to a Kiali URL.
(string)
DEPRECATED AFTER v1.73: The name of the cluster.
(string)
DEPRECATED AFTER v1.73: The instance name of this Kiali installation.
(string)
DEPRECATED AFTER v1.73: The namespace into which Kiali is installed.
(string)
DEPRECATED AFTER v1.73: The URL of Kiali in the cluster.
(array)
Enable observability tabs (Traffic, Logs, Metrics, Traces) for custom workload types beyond the built-in Kubernetes controllers.
(string)
*Required*
The API group of the custom workload type (e.g., ‘argoproj.io’).
(string)
*Required*
The kind of the custom workload type (e.g., ‘Rollout’).
(string)
*Required*
The API version of the custom workload type (e.g., ‘v1alpha1’).
(array)
There may be some features that admins do not want to be accessible to users (even in ‘view only’ mode). In this case, this setting allows you to disable one or more of those features entirely.
(boolean)
Flag to enable/disable an Action to edit annotations.
(boolean)
Flag to enable/disable an Action to label a namespace for automatic Istio Sidecar injection.
(boolean)
Flag to activate the Kiali functionality of upgrading namespaces to point to an installed Istio Canary revision.
(object)
Default settings for the UI. These defaults apply to all users.
(object)
Default settings for the Graph UI.
(array)
A list of commonly used and useful find expressions that will be provided to the user out-of-box.
(boolean)
If true this option will be selected and take effect automatically. Note that only one option in the list can have this value be set to true.
(string)
Human-readable text to let the user know what the expression does.
(array)
A list of commonly used and useful hide expressions that will be provided to the user out-of-box.
(boolean)
If true this option will be selected and take effect automatically. Note that only one option in the list can have this value be set to true.
(string)
Human-readable text to let the user know what the expression does.
(object)
Various presentation options.
(string)
The traffic animation style. Value must be one of: dash or point.
(object)
These settings determine which rates are used to determine graph traffic.
(string)
Ambient traffic is reported by ztunnel and/or waypoints. Value must be one of: none, total, waypoint, or ztunnel.
(string)
gRPC traffic is measured in requests or sent/received/total messages. Value must be one of: none, requests, sent, received, or total.
(string)
HTTP traffic is measured in requests. Value must be one of: none or requests.
(string)
TCP traffic is measured in sent/received/total bytes. Only request traffic supplies response codes. Value must be one of: none, sent, received, or total.
(object)
Default settings for the i18n values.
(string)
Default language used in Kiali application.
(boolean)
If true Kiali masthead displays language selector icon.
(object)
Default settings for the List views (Apps, Workloads, etc).
(boolean)
Include Health column (by default) for applicable list views. Setting to false can improve performance.
(boolean)
Include Istio resources (by default) in Details column for applicable list views. Setting to false can improve performance.
(boolean)
Include Configuration validation column (by default) for applicable list views. Setting to false can improve performance.
(boolean)
If true list pages display checkbox toggles for the include options, Otherwise the configured settings are applied but can not be changed by the user.
(object)
Default settings for the Mesh UI.
(array)
A list of commonly used and useful find expressions that will be provided to the user out-of-box.
(boolean)
If true this option will be selected and take effect automatically. Note that only one option in the list can have this value be set to true.
(string)
Human-readable text to let the user know what the expression does.
(array)
A list of commonly used and useful hide expressions that will be provided to the user out-of-box.
(boolean)
If true this option will be selected and take effect automatically. Note that only one option in the list can have this value be set to true.
(string)
Human-readable text to let the user know what the expression does.
(object)
Additional label aggregation for inbound metric pages in detail pages.
You will see these configurations in the ‘Metric Settings’ drop-down.
An example,
spec:
  kiali_feature_flags:
    ui_defaults:
      metrics_inbound:
        aggregations:
        - display_name: Istio Network
          label: topology_istio_io_network
        - display_name: Istio Revision
          label: istio_io_rev
(boolean)
Flag to indicate if only one option can be selected for this aggregation.
(object)
Additional label aggregation for outbound metric pages in detail pages.
You will see these configurations in the ‘Metric Settings’ drop-down.
An example,
spec:
  kiali_feature_flags:
    ui_defaults:
      metrics_outbound:
        aggregations:
        - display_name: Istio Network
          label: topology_istio_io_network
        - display_name: Istio Revision
          label: istio_io_rev
(boolean)
Flag to indicate if only one option can be selected for this aggregation.
(string)
Duration of metrics to fetch on each refresh. Value must be one of: 1m, 2m, 5m, 10m, 30m, 1h, 3h, 6h, 12h, 1d, 7d, or 30d
(array)
Default selections for the namespace selection dropdown. Non-existent or inaccessible namespaces will be ignored. Omit or set to an empty array for no default namespaces.
(string)
The automatic refresh interval for pages offering automatic refresh. Manual requires user action even for initial page load. Value must be one of: pause, manual, 10s, 15s, 30s, 1m, 5m or 15m
(object)
Default settings for the Tracing UI.
(integer)
The default limit for the number of traces that will be fetched. It can be customized in the UI. It must be a number between 10 and 1000.
(object)
Features specific to the validations subsystem.
(array)
A list of one or more validation codes whose errors are to be ignored.
(string)
A validation code (e.g. KIA0101) for a specific validation error that is to be ignored.
(boolean)
The KIA0301 validation checks duplicity of host and port combinations across all Istio Gateways. This includes also Gateways with ‘*’ in hosts. But Istio considers such a Gateway with a wildcard in hosts as the last in order, after the Gateways with FQDN in hosts. This option is to skip Gateways with wildcards in hosts from the KIA0301 validations but still keep Gateways with FQDN hosts.
(object)
Unstructured section for internal testing and debugging features.
(object)
Configuration of Kiali’s access of the Kubernetes API.
(integer)
The Burst value of the Kubernetes client.
(integer)
The ratio interval (expressed in seconds) used for the cache to perform a full refresh. Only used when cache_enabled is true.
(integer)
This Kiali cache is a list of namespaces per user. This is typically a short-lived cache compared with the duration of the namespace cache defined by the cache_duration setting. This is specified in seconds.
(string)
The name of the cluster Kiali is deployed in. This is also known as the home cluster. This is only used in multi cluster environments. This must be set when clustering.ignore_home_cluster=true. If not set, Kiali will try to auto detect the cluster name from the Istiod deployment or use the default ‘Kubernetes’.
(array)
List of controllers that won’t be used for Workload calculation. Kiali queries Deployment, ReplicaSet, ReplicationController, DeploymentConfig, StatefulSet, Job and CronJob controllers. Deployment and ReplicaSet will be always queried, but ReplicationController, DeploymentConfig, StatefulSet, Job and CronJobs can be skipped from Kiali workloads queries if they are present in this list.
(integer)
The QPS value of the Kubernetes client.
(integer)
A user’s login token expiration specified in seconds. This is applicable to token and header auth strategies only.
(string)
The signing key used to generate tokens for user authentication. Because this is potentially sensitive, you have the option to store this value in a secret using the pattern secret:<secretName>:<secretKey>. When using a secret, the signing key is read dynamically, enabling automatic rotation without pod restart. If left as an empty string, a secret with a random signing key will be generated for you. The signing key must be 16, 24 or 32 byte long.
(object)
Configuration that controls some core components within the Kiali Server.
(string)
Where the Kiali server is bound. The console and API server are accessible on this host.
(boolean)
When true, allows additional audit logging on write operations.
(boolean)
When true, allows the web console to send requests to other domains other than where the console came from. Typically used for development environments only.
(boolean)
When true, Kiali serves http requests with gzip enabled (if the browser supports it) when the requests are over 1400 bytes.
(integer)
If deployment.service_type is ‘NodePort’ and this value is set, then this is the node port that the Kiali service will listen to.
(object)
Settings to enable observability into the Kiali server itself.
(object)
Settings that control how Kiali itself emits its own metrics.
(boolean)
The metrics HTTP listener is started when either this or health_status.enabled is true.
(object)
Settings for the kiali_health_status Prometheus gauge (per-entity health from the health cache refresh). Independent of metrics.enabled.
(boolean)
When true, Kiali exports kiali_health_status metrics during health cache refresh.
(integer)
Number of consecutive health refresh cycles an entity may report NA or be missing before its kiali_health_status series is removed. Values less than or equal to 0 use the server default (3).
(integer)
The port that the server will bind to in order to receive metric requests. This is the port Prometheus will need to scrape when collecting metrics from Kiali.
(object)
Settings that control how the Kiali server itself emits its own tracing data.
(string)
The collector type to use. Today the only valid value is otel.
(string)
Used to determine where the Kiali server tracing data will be stored.
(boolean)
When true, the Kiali server itself will product its own tracing data.
(object)
Specific properties when the collector type is otel.
(string)
DEPRECATED since v2.20: This setting is deprecated and will be ignored. To configure custom CA certificates, use the kiali-cabundle ConfigMap instead. See the TLS Configuration documentation for details.
(string)
Protocol. Value must be one of: http, https or grpc.
(boolean)
If true, TLS certificate verification will not be performed. This is an unsecure option and is recommended only for testing.
(boolean)
Enable TLS for the collector. This must be specified when protocol is https or grpc.
(number)
Sampling rate for Kiali server traces. >= 1.0 always samples and <= 0 never samples.
(integer)
The port that the server will bind to in order to receive console and API requests.
(object)
Controls the internal profiler used to debug the internals of Kiali
(boolean)
When ‘true’, the profiler will be enabled and accessible at /debug/pprof/ on the Kiali endpoint.
(boolean)
When true, the /api endpoint will require users to authenticate themselves. When false, users need not authenticate with Kiali in order to get basic runtime info about the server via the /api endpoint. This setting is ignored if auth.strategy is ‘anonymous’.
(string)
Defines the public domain where Kiali is being served. This is the ‘domain’ part of the URL (usually it’s a fully-qualified domain name). For example, kiali.example.org. When empty, Kiali will try to guess this value from HTTP headers. On non-OpenShift clusters, you must populate this value if you want to enable cross-linking between Kiali instances in a multi-cluster setup.
(string)
Define the history mode of kiali UI. Value must be one of: browser or hash.
(string)
Defines the ingress port where the connections come from. This is usually necessary when the application responds through a proxy/ingress, and it does not forward the correct headers (when this happens, Kiali cannot guess the port). When empty, Kiali will try to guess this value from HTTP headers.
(string)
Defines the context root path for the Kiali console and API endpoints and readiness probes. When providing a context root path that is not /, do not add a trailing slash (i.e. use /kiali not /kiali/). When empty, this will default to / on OpenShift and /kiali on other Kubernetes environments.
(string)
Defines the public HTTP schema used to serve Kiali. Value must be one of: http or https. When empty, Kiali will try to guess this value from HTTP headers. On non-OpenShift clusters, you must populate this value if you want to enable cross-linking between Kiali instances in a multi-cluster setup.
(string)
The version of the Ansible role that will be executed in order to install Kiali.
This also indirectly determines the version of Kiali that will be installed.
You normally will want to use default since this is the only officially supported value today.
If not specified, the value of default is assumed which means the most recent Ansible role is used;
thus the most recent release of Kiali will be installed.
Refer to this file to see what the valid values are for this version field (as defined in the master branch),
https://github.com/kiali/kiali-operator/blob/master/playbooks/kiali-default-supported-images.yml
This version setting affects the defaults of the deployment.image_name and
deployment.image_version settings. See the documentation for those settings below for
additional details. In short, this version setting will dictate which version of the
Kiali image will be deployed by default. However, if you explicitly set deployment.image_name
and/or deployment.image_version to reference your own custom image, that will override the
default Kiali image to be installed; therefore, you are responsible for ensuring those settings
are compatible with the Ansible role that will be executed in order to install Kiali (i.e. your
custom Kiali image must be compatible with the rest of the configuration and resources the
operator will install).
(object)
The processing status of this CR as reported by the Kiali operator.
7 - Multi-cluster
Configuring Kiali for a multi-cluster mesh.
Kiali has support for Istio multi-cluster installations.
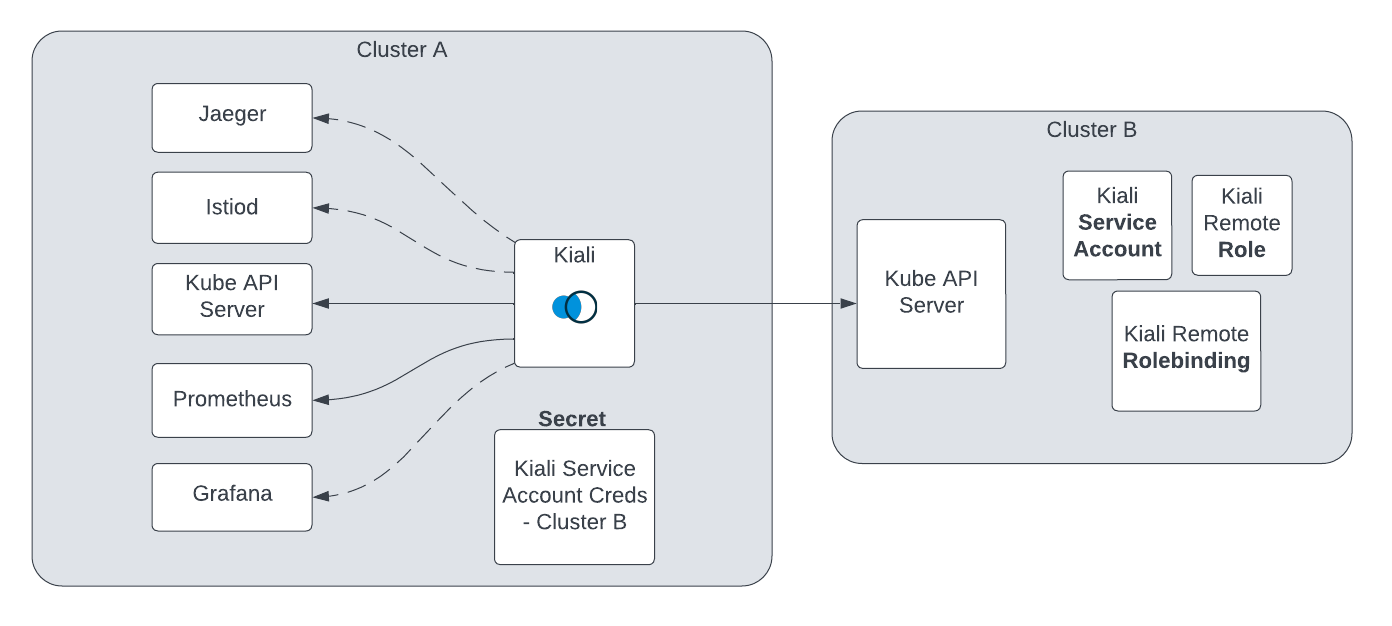
Before proceeding with the setup, ensure you meet the requirements.
Requirements
-
Aggregated metrics and traces. Kiali needs a single endpoint for metrics and a single endpoint for traces where it can consume aggregated metrics/traces across all clusters. There are many ways to aggregate metrics/traces such as Prometheus federation or using OTEL collector pipelines but setting these up are outside of the scope of Kiali.
-
Anonymous, OpenID or OpenShift authentication strategy. The unified multi-cluster configuration currently only supports anonymous, OpenID and OpenShift authentication strategies. In addition, current support varies by provider for OpenID across clusters.
Setup
The unified Kiali multi-cluster setup requires the Kiali Service Account (SA) to have read access to each Kubernetes cluster in the mesh. This is separate from the user credentials that are required when a user logs into Kiali. The user credentials are used to check user access to a namespace and to perform write operations. In anonymous mode, the Kiali SA is used for all operations. Write access need not be required if you only want to give Kiali “view-only” capabilities. To give the Kiali SA access to each remote cluster, a kubeconfig with credentials needs to be created and mounted into the Kiali pod. While the location of Kiali in relation to the controlplane and dataplane may change depending on your Istio deployment model, the requirements will remain the same.
Although not required for some deployment models, it is recommended that the Kiali namespace and instance name be consistent across all clusters, including remote clusters without a Kiali server deployed. If not using default values, the following Kiali CR settings should typically have consistent values:
spec.deployment.namespacespec.deployment.instance_name
If you would like to keep a separate Kiali per cluster and do not want to give Kiali access to remote clusters, you can still manually specify the remote cluster and remote Kiali URLs in the Kiali configuration and the UI will try to provide links to the remote Kiali where appropriate. See
below for more details.
-
Create a SA and its associated resources on the remote cluster. In order for Kiali to access a remote cluster, you first must create a SA and its role/role binding with the proper permissions. There are three ways to do this:
-
Kiali Operator (recommended): Deploy the Kiali Operator on the remote cluster and create a Kiali CR with spec.deployment.remote_cluster_resources_only: true. The Operator will create and manage the SA, role, and role binding. Deleting the Kiali CR will remove these resources.
-
Kiali Server helm chart: Use the kiali-server helm chart with --set deployment.remote_cluster_resources_only=true.
-
kiali-prepare-remote-cluster.sh script: Use the script with --process-remote-resources true. See the script usage notes in step 2 below.
-
Create a remote cluster secret. Kiali needs a kubeconfig stored in a Kubernetes secret in order to access the remote cluster. This secret contains the SA token from step 1 and the remote cluster’s connection info. A remote cluster secret will look something like this:
apiVersion: v1
kind: Secret
metadata:
  name: my-cluster-name
  labels:
    kiali.io/multiCluster: "true"
stringData:
  my-cluster-name: |
    apiVersion: v1
    kind: Config
    preferences: {}
    current-context: my-cluster-name
    contexts:
    - name: my-cluster-name
      context:
        cluster: my-cluster-name
        user: my-cluster-name
    users:
    - name: my-cluster-name
      user:
        token: <...the long remote cluster SA token string goes here...>
    clusters:
    - name: my-cluster-name
      cluster:
        server: <...the URL to your remote cluster goes here...>
        certificate-authority-data: <...the long CA data goes here...>
You can place multiple kubeconfigs in a single secret, each under its own key in stringData where the key name must be the name of the remote cluster. Name the secret kiali-multi-cluster-secret for the added benefit of having the operator automatically detect this secret without having to configure anything within the Kiali CR. If you do name the secret kiali-multi-cluster-secret you also can add to it the label kiali.io/kiali-multi-cluster-secret="true" which will tell the operator to restart the Kiali Server pod automatically when the secret changes thus allowing the server to pick up the changes immediately. A multi-cluster secret with two clusters named my-cluster-name and my-other-cluster would look like this:
apiVersion: v1
kind: Secret
metadata:
  name: kiali-multi-cluster-secret
  labels:
    kiali.io/kiali-multi-cluster-secret: "true"
stringData:
  my-cluster-name: |
    apiVersion: v1
    kind: Config
    preferences: {}
    current-context: my-cluster-name
    contexts:
    - name: my-cluster-name
      context:
        cluster: my-cluster-name
        user: my-cluster-name
    users:
    - name: my-cluster-name
      user:
        token: <...the long remote cluster SA token string goes here...>
    clusters:
    - name: my-cluster-name
      cluster:
        server: <...the URL to your remote cluster goes here...>
        certificate-authority-data: <...the long CA data goes here...>
  my-other-cluster: |
    apiVersion: v1
    kind: Config
    preferences: {}
    current-context: my-other-cluster
    contexts:
    - name: my-other-cluster
      context:
        cluster: my-other-cluster
        user: my-other-cluster
    users:
    - name: my-other-cluster
      user:
        token: <...the long remote cluster SA token string goes here...>
    clusters:
    - name: my-other-cluster
      cluster:
        server: <...the URL to your remote cluster goes here...>
        certificate-authority-data: <...the long CA data goes here...>
The verify-kiali-permissions.sh script can be used to check that your remote cluster secret provides the necessary permissions that Kiali needs to access the remote cluster. See the comments at the top of the script and its --help output for details on how to run it, but here’s an example:
curl -L -o verify-kiali-permissions.sh https://raw.githubusercontent.com/kiali/kiali/master/hack/istio/multicluster/verify-kiali-permissions.sh
chmod +x verify-kiali-permissions.sh
./verify-kiali-permissions.sh --kubeconfig-secret istio-system:kiali-multi-cluster-secret:my-cluster-name --kiali-version v2.10.0
It is up to you how you want to create and manage the token and secret, however, you can use the kiali-prepare-remote-cluster.sh script (with the --process-kiali-secret true option) to simplify this process for you.
The kiali-prepare-remote-cluster.sh script can be used to:
- Create a Kiali SA and its role/role-binding in the remote cluster
and/or,
- Create a kubeconfig file and store it in a Kubernetes secret that is created in the namespace where Kiali is deployed.
In order to run this script you will need adequate permissions configured in your local kubeconfig for both the cluster on which Kiali is deployed and the remote cluster.
For example:
curl -L -o kiali-prepare-remote-cluster.sh https://raw.githubusercontent.com/kiali/kiali/master/hack/istio/multicluster/kiali-prepare-remote-cluster.sh
chmod +x kiali-prepare-remote-cluster.sh
./kiali-prepare-remote-cluster.sh --kiali-cluster-context east --remote-cluster-context west --view-only false --process-kiali-secret true --process-remote-resources true
If you used the Kiali Operator (or helm chart) to create the remote cluster resources (step 1 above) and are using this script only to create the remote cluster secret (--process-remote-resources false --process-kiali-secret true), you must pass --kiali-resource-name set to the name of the Service Account created by the Operator. The Operator names the SA <instance_name>-service-account (e.g. kiali-service-account for the default instance name kiali). For example:
./kiali-prepare-remote-cluster.sh \
  --kiali-cluster-context east \
  --remote-cluster-context west \
  --kiali-resource-name kiali-service-account \
  --process-remote-resources false \
  --process-kiali-secret true \
  --view-only false
Specifying the remote cluster name: The script derives the remote cluster name from the kubeconfig context, which may contain characters not valid in a Kubernetes secret key (e.g. colons in OpenShift-generated context names). Always pass --remote-cluster-name explicitly, set to the name Istio uses for the remote cluster, to avoid this issue:
./kiali-prepare-remote-cluster.sh \
  ... \
  --remote-cluster-name west
Use the option --help for additional details on using the script to create and delete the remote cluster resources and secrets.
-
Configure Kiali. The Kiali Operator needs to know about the remote cluster secrets so it can mount them into the Kiali Server pod. There are three ways to do this:
-
Auto-discovery by label (default): The Kiali Operator will automatically detect any secret in the Kiali deployment namespace that has the label kiali.io/multiCluster="true". The secrets created by the kiali-prepare-remote-cluster.sh script are labeled this way and will be auto-detected with no additional Kiali CR configuration needed.
-
Explicit configuration: In the Kiali CR you can explicitly specify each remote cluster secret rather than rely on auto-discovery.
-
Single combined secret: Create a single secret named kiali-multi-cluster-secret in the Kiali deployment namespace containing kubeconfigs for all remote clusters, each under its own top-level key in stringData where the key is the cluster name. If you also label this secret with kiali.io/kiali-multi-cluster-secret="true", the Kiali Operator will auto-detect changes and roll out a new Kiali Server pod automatically.
Do not use the label kiali.io/kiali-multi-cluster-secret="true" on any other secret not specifically named kiali-multi-cluster-secret. The operator will not have permission to see that secret and errors will occur if you attempt this.
If you have multiple Kiali Servers deployed in the same namespace, and you want to use that single secret named kiali-multi-cluster-secret, all Kiali Servers in that namespace are required to use that secret. If you want each Kiali Server to talk to a different set of clusters, you must not use the kiali-multi-cluster-secret secret.
Once the Kiali Operator knows about the remote cluster secrets (either through auto-discovery or through explicit configuration) it will mount them into the Kiali Server pod, putting Kiali in “multi-cluster” mode. Kiali will begin using those credentials to communicate with the other clusters in the mesh.
-
Configure user access. When using anonymous mode, the Kiali SA credentials will be used to display mesh info to the user. When not using anonymous mode, Kiali will check the user’s access to each configured cluster’s namespace before showing the user any resources from that namespace.
- For OpenID, refer to your OIDC provider’s instructions for configuring user access to a Kubernetes cluster.
- For OpenShift, see the OpenShift multi-cluster documentation for important information about logging into remote clusters from the Kiali UI. This step is required — users must log into each cluster via the Kiali UI to access resources on that cluster.
-
Optional - Narrow metrics to mesh. If your unified metrics store also contains data outside of your mesh, you can limit which metrics Kiali will query for by setting the query_scope configuration.
That’s it! From here you can login to Kiali and manage your mesh across all clusters from a single Kiali instance.
Removing a Cluster
To remove a cluster from Kiali, you must delete the associated remote cluster secret. If you originally created the remote cluster secret via the kiali-prepare-remote-cluster.sh script, run that script again with the same command line options as before but also pass in the command line option --delete true.
Don’t forget to remove the resources (such as the SA and its role/role binding) from the remote cluster. If you created these resources with the Kiali Operator, simply delete the Kiali CR from the remote cluster and these resources will be removed. If you used the kiali-prepare-remote-cluster.sh script to create these resources, use it to remove these resources.
After the remote cluster secret has been removed, you must then tell the Kiali Operator to re-deploy the Kiali Server so the Kiali Server no longer attempts to access the now-deleted remote cluster secret. If you are using auto-discovery, you can tell the Kiali Operator to do this by touching the Kiali CR. The easiest way to do this is to simply add or modify any annotation on the Kiali CR. It is recommended that you use the kiali.io/reconcile annotation as described here. If you did not rely on auto-discovery but instead explicitly specified each remote cluster secret in the Kiali CR, then you simply have to remove the now-deleted remote cluster secret’s information from the Kiali CR’s clustering.clusters section. Finally, if you are using the single kiali-multi-cluster-secret to define all of your remote clusters (and you labeled that secret with kiali.io/kiali-multi-cluster-secret="true"), then you do not have to do anything other than delete that one secret. The Kiali Operator will detect that the secret has been removed and will re-deploy the Kiali Server automatically.
Adding an Inaccessible Cluster
If you would like to keep a separate Kiali per cluster or you do not want to give Kiali access to remote clusters, you can still manually specify the remote clusters and remote Kiali URLs in the Kiali configuration and the Kiali UI will try to provide links to the remote Kiali UIs where appropriate.
For example, if there is a Kiali on the east cluster that does not have access to the west cluster and a Kiali on the west cluster that does not have access to the east cluster, you can add the following to your Kiali configurations to have each Kiali generate links to the Kiali for that cluster.
East Kiali configuration
clustering:
  clusters:
    name: west
  kiali_urls:
    cluster_name: west
    instance_name: kiali
    namespace: istio-system
    url: https://kiali-external.west.example.com
West Kiali configuration
clustering:
  clusters:
    name: east
  kiali_urls:
    cluster_name: east
    instance_name: kiali
    namespace: istio-system
    url: https://kiali-external.east.example.com
7.1 - ACM Observability
Configure Kiali to use Red Hat Advanced Cluster Management Observability for centralized metrics in multi-cluster OpenShift environments.
OpenShift Only: This guide is specifically for Red Hat OpenShift environments using Red Hat Advanced Cluster Management (ACM) for Kubernetes. ACM is an OpenShift-specific product.
Overview
Red Hat Advanced Cluster Management (ACM) provides centralized observability for multi-cluster OpenShift environments through its Observability Service. When ACM Observability is enabled, metrics from all managed clusters (including the hub cluster itself) are collected and aggregated into a central Thanos-based storage system.
Kiali can query these aggregated metrics either through ACM’s external Observatorium API (using mTLS authentication) or directly through internal Thanos services. This guide explains both options, with detailed steps for the Observatorium API approach.
Architecture
Components
On the Hub Cluster:
- ACM Observability Service: Centralized observability platform
- Observatorium API: External HTTPS endpoint with mTLS authentication
- Thanos: Metrics storage and query engine (Query, Query Frontend, Receive, Store)
On Managed Clusters (Hub + Spokes):
- User Workload Monitoring (UWM): OpenShift’s Prometheus for user workloads
- PodMonitor/ServiceMonitor: Scrape Istio metrics from:
- Sidecar proxies (in application namespaces)
- Control plane (istiod in istio-system)
- Ztunnel (in ztunnel namespace, for L4 metrics in Ambient mode)
- Waypoint proxies (in application namespaces, for L7 metrics in Ambient mode)
- Metrics Allowlist ConfigMaps: Define which metrics ACM should collect
- Metrics Collector: Runs on each managed cluster and pushes its Prometheus metrics to the hub cluster’s Thanos every 5 minutes (default)
Kiali Deployment Location:
Kiali can be deployed on any cluster with network access to:
- The hub cluster’s metrics backend (Observatorium API or internal Thanos services)
- Each managed cluster’s Kubernetes API (for workload and configuration data)
Common deployment locations:
- Hub cluster (recommended): Co-located with ACM for lower latency metric queries and simplified networking. Can use internal Thanos services (HTTP) or external Observatorium API (HTTPS). Typically requires external deployment mode (
ignore_home_cluster: true) since the hub usually doesn’t run mesh workloads or an Istio control plane.
- Spoke/managed cluster: Kiali deployed alongside the mesh workloads or the Istio control plane. Must use external Observatorium API route.
- Separate management cluster: Kiali deployed externally in dedicated “external deployment” mode (see External Kiali). Must use external Observatorium API route.
This guide assumes Kiali is deployed on the hub cluster in external deployment mode, but the configuration applies to any deployment location.
Metrics Flow
There are two independent flows:
Ingestion (managed cluster → hub):
- Istio data plane components (sidecars, ztunnel, or waypoint proxies) expose metrics at
:15020/stats/prometheus.
- User Workload Monitoring Prometheus scrapes those metrics (typically every 30s).
- The ACM observability collector/agent on the managed cluster reads from Prometheus and ships metrics to the hub (typically every 5 minutes).
- The hub stores them in Thanos Receive/Store and serves them through Thanos Query Frontend.
Query (Kiali → hub):
Kiali can query metrics through either of these paths:
Via Observatorium API Route (HTTPS with mTLS):
- Kiali queries the external Observatorium API route.
- Observatorium forwards the request to Thanos Query Frontend.
- Thanos Query Frontend reads from Thanos Store/Receive and returns the result back through Observatorium to Kiali.
Via Internal Thanos Service (HTTP):
- Kiali queries the internal Thanos Query Frontend service directly within the cluster, bypassing Observatorium.
Expected Latency: 5-6 minutes from traffic generation to visibility in Kiali due to the 5-minute (default) push interval.
Prerequisites
1. ACM Observability Service
ACM MultiClusterObservability must be installed on the hub cluster:
# Verify ACM Observability is running
oc get mco observability

# Check Observatorium API route
oc get route observatorium-api -n open-cluster-management-observability
2. User Workload Monitoring
User Workload Monitoring must be enabled on all clusters (hub and spokes):
# Enable UWM by editing cluster-monitoring-config
oc -n openshift-monitoring edit configmap cluster-monitoring-config

# Add:
# data:
#   config.yaml: |
#     enableUserWorkload: true

# Verify UWM pods are running
oc get pods -n openshift-user-workload-monitoring
See: Enabling monitoring for user-defined projects
3. Istio Metrics Collection
Create ServiceMonitor and PodMonitor resources to collect Istio metrics. The PodMonitor for sidecars must be created in each namespace with Istio sidecars because OpenShift monitoring ignores namespaceSelector in these resources. The ServiceMonitor for istiod is created once in istio-system.
ServiceMonitor for istiod (in istio-system):
apiVersion: monitoring.coreos.com/v1
kind: ServiceMonitor
metadata:
  name: istiod-monitor
  namespace: istio-system
spec:
  targetLabels:
  - app
  selector:
    matchLabels:
      istio: pilot
  endpoints:
  - port: http-monitoring
    interval: 30s
PodMonitor for Istio proxies (must be applied in every mesh namespace):
apiVersion: monitoring.coreos.com/v1
kind: PodMonitor
metadata:
  name: istio-proxies-monitor
  namespace: <your-mesh-namespace>
spec:
  selector:
    matchExpressions:
    - key: istio-prometheus-ignore
      operator: DoesNotExist
  podMetricsEndpoints:
  - path: /stats/prometheus
    interval: 30s
    relabelings:
    - action: keep
      sourceLabels: ["__meta_kubernetes_pod_container_name"]
      regex: "istio-proxy"
    - action: keep
      sourceLabels: ["__meta_kubernetes_pod_annotationpresent_prometheus_io_scrape"]
    - action: replace
      regex: (\d+);(([A-Fa-f0-9]{1,4}::?){1,7}[A-Fa-f0-9]{1,4})
      replacement: '[$2]:$1'
      sourceLabels: ["__meta_kubernetes_pod_annotation_prometheus_io_port","__meta_kubernetes_pod_ip"]
      targetLabel: "__address__"
    - action: replace
      regex: (\d+);((([0-9]+?)(\.|$)){4})
      replacement: '$2:$1'
      sourceLabels: ["__meta_kubernetes_pod_annotation_prometheus_io_port","__meta_kubernetes_pod_ip"]
      targetLabel: "__address__"
    - sourceLabels: ["__meta_kubernetes_pod_label_app_kubernetes_io_name","__meta_kubernetes_pod_label_app"]
      separator: ";"
      targetLabel: "app"
      action: replace
      regex: "(.+);.*|.*;(.+)"
      replacement: "${1}${2}"
    - sourceLabels: ["__meta_kubernetes_pod_label_app_kubernetes_io_version","__meta_kubernetes_pod_label_version"]
      separator: ";"
      targetLabel: "version"
      action: replace
      regex: "(.+);.*|.*;(.+)"
      replacement: "${1}${2}"
    - sourceLabels: ["__meta_kubernetes_namespace"]
      action: replace
      targetLabel: namespace
    - action: replace
      replacement: "<your-mesh-identification-string>"
      targetLabel: mesh_id
See: Configuring OpenShift Monitoring with Service Mesh
Ambient Mode Metrics
If you are using Istio’s Ambient mode instead of (or in addition to) sidecar mode, you need additional PodMonitors to collect metrics from the Ambient data plane components.
Understanding Ambient Mode Metrics
Ambient mode uses a layered architecture with two metric sources:
Ztunnel (L4 metrics only)
- Runs as a DaemonSet (namespace varies by installation)
- Handles all L4 traffic for pods enrolled in ambient mode
- Produces TCP-level metrics:
istio_tcp_sent_bytes_totalistio_tcp_received_bytes_totalistio_tcp_connections_opened_totalistio_tcp_connections_closed_total
- Does not produce HTTP metrics
Waypoint proxies (L7 metrics)
- Run as Deployments in application namespaces
- Optional L7 proxies deployed per-namespace or per-service
- Produce full HTTP metrics (same as sidecars):
istio_requests_totalistio_request_duration_milliseconds_*istio_request_bytes_*istio_response_bytes_*- Plus all TCP metrics listed above
If you only use ztunnel (no waypoints), Kiali will show TCP traffic but not HTTP-level details like response codes or latency histograms.
PodMonitor for Ztunnel
Create a PodMonitor in the namespace where ztunnel runs. Ztunnel pods expose metrics using the same interface as sidecars:
- Container name:
istio-proxy
- Annotation:
prometheus.io/scrape: "true"
- Metrics path:
/stats/prometheus on port 15020
Because ztunnel uses the same metrics interface, you can use the same PodMonitor configuration shown in the Istio Metrics Collection section above, changing only the namespace field to match your ztunnel namespace.
Note: The ztunnel namespace location depends on your Istio installation method. Verify your ztunnel namespace with: oc get pods -l app=ztunnel -A
PodMonitor for Waypoint Proxies
Create a PodMonitor in each namespace with a waypoint. Waypoint pods also expose metrics using the same interface as sidecars:
- Container name:
istio-proxy
- Annotation:
prometheus.io/scrape: "true"
- Metrics path:
/stats/prometheus on port 15020
Because waypoints use the same metrics interface, you can use the same PodMonitor configuration shown in the Istio Metrics Collection section above.
4. Metrics Allowlist Configuration
ACM only collects metrics that are explicitly allowlisted. For Istio metrics to be collected, create a ConfigMap named observability-metrics-custom-allowlist in the source namespace (see note below) with key uwl_metrics_list.yaml:
apiVersion: v1
kind: ConfigMap
metadata:
  name: observability-metrics-custom-allowlist
  namespace: <your-mesh-namespace>
data:
  uwl_metrics_list.yaml: |
    names:
    # Core Istio metrics below. For additional metrics that Kiali uses,
    # see: https://kiali.io/docs/faq/general/#requiredmetrics
    #
    # L7 (HTTP) metrics - from sidecars and waypoint proxies
    - istio_requests_total
    - istio_request_duration_milliseconds_bucket
    - istio_request_duration_milliseconds_sum
    - istio_request_duration_milliseconds_count
    - istio_request_bytes_bucket
    - istio_request_bytes_sum
    - istio_request_bytes_count
    - istio_response_bytes_bucket
    - istio_response_bytes_sum
    - istio_response_bytes_count
    # L4 (TCP) metrics - from sidecars, waypoint proxies, AND ztunnel
    - istio_tcp_sent_bytes_total
    - istio_tcp_received_bytes_total
    - istio_tcp_connections_opened_total
    - istio_tcp_connections_closed_total
Critical: The ConfigMap must be in the source namespace where metrics originate (e.g., istio-system, application namespaces), NOT in open-cluster-management-observability.
Ambient Mode: The same allowlist works for all Istio data plane components. However, ztunnel only produces TCP metrics (istio_tcp_*), so HTTP metrics in the allowlist will have no data from ztunnel. Waypoints produce both TCP and HTTP metrics, same as sidecars. Create the allowlist ConfigMap in each namespace where you have a PodMonitor, including the namespace where ztunnel runs and any namespaces with waypoint proxies.
See: Adding user workload metrics
Configuring Kiali for ACM Observability
Choosing Between Observatorium API and Internal Thanos Services
You have two options for connecting Kiali to ACM metrics:
Option 1: Observatorium API Route (HTTPS with mTLS)
external_services:
  prometheus:
    url: "https://observatorium-api-<namespace>.<apps-domain>/api/metrics/v1/default"
    auth:
      type: none
      cert_file: "secret:acm-observability-certs:tls.crt"
      key_file: "secret:acm-observability-certs:tls.key"
Provides:
- HTTPS with mTLS authentication and encryption
- External access (can be accessed from outside the cluster if needed)
- RBAC enforcement via Observatorium
- Multi-tenant isolation
- Requires certificate setup
Option 2: Internal Thanos Service (HTTP)
external_services:
  prometheus:
    url: "http://observability-thanos-query-frontend.open-cluster-management-observability.svc:9090"
    auth:
      type: none
Provides:
- Simpler setup (no certificates required)
- Direct access to Thanos (potentially lower latency)
- Internal cluster networking only
- HTTP only (no encryption between Kiali and Thanos)
Recommendation: Use the Observatorium API for production environments where you want encrypted connections and proper authentication. Use internal services for development/testing environments where simplicity is preferred or where network security is already provided by the cluster infrastructure.
The rest of this guide focuses on the Observatorium API approach with mTLS authentication.
Step 1: Obtain mTLS Certificates from ACM
ACM automatically creates long-lived client certificates (1 year validity) for accessing the Observatorium API. Extract these from the hub cluster:
# Extract client certificate (for authentication)
oc get secret observability-grafana-certs \
  -n open-cluster-management-observability \
  -o jsonpath='{.data.tls\.crt}' | base64 -d > tls.crt

# Extract client key (for authentication)
oc get secret observability-grafana-certs \
  -n open-cluster-management-observability \
  -o jsonpath='{.data.tls\.key}' | base64 -d > tls.key
Note: These certificates are created automatically when ACM MultiClusterObservability is deployed and are already trusted by the Observatorium API.
ACM Version Note: Secret names may vary depending on your ACM version. Before proceeding, verify the secret exists:
oc get secrets -n open-cluster-management-observability | grep -i cert
If observability-grafana-certs doesn’t exist, look for similar secrets containing client certificates.
Extract the CA certificate that signed the Observatorium API server certificate. This is used by Kiali to validate the server’s TLS certificate.
First, identify which CA issued the server certificate:
# Get the Observatorium API route hostname
HOST=$(oc get route observatorium-api -n open-cluster-management-observability -o jsonpath='{.spec.host}')

# Check who issued the server certificate
echo | openssl s_client -connect "${HOST}:443" -servername "${HOST}" -showcerts 2>/dev/null | openssl x509 -noout -issuer
Example output:
issuer=C=US, O=Red Hat, Inc., CN=observability-server-ca-certificate
Then, extract the matching CA certificate based on the issuer CN:
If the issuer CN is observability-server-ca-certificate:
oc get secret observability-server-ca-certs \
  -n open-cluster-management-observability \
  -o jsonpath='{.data.ca\.crt}' | base64 -d > server-ca.crt
If the issuer CN is observability-client-ca-certificate:
oc get secret observability-client-ca-certs \
  -n open-cluster-management-observability \
  -o jsonpath='{.data.ca\.crt}' | base64 -d > server-ca.crt
Note: Both secrets are in the open-cluster-management-observability namespace. The exact CA used may vary depending on your ACM version and configuration.
Step 3: Create Kubernetes Resources
Note: <kiali-namespace> and ${KIALI_NAMESPACE} are used as a placeholder for the namespace where Kiali is deployed. This is commonly istio-system but is not required to be - replace with your actual Kiali namespace.
Create the mTLS certificate secret in Kiali’s namespace:
KIALI_NAMESPACE="istio-system"  # Replace with your Kiali namespace

oc create secret generic acm-observability-certs \
  -n ${KIALI_NAMESPACE} \
  --from-file=tls.crt=tls.crt \
  --from-file=tls.key=tls.key
Create the CA bundle ConfigMap in Kiali’s namespace:
oc create configmap kiali-cabundle \
  -n ${KIALI_NAMESPACE} \
  --from-file=additional-ca-bundle.pem=server-ca.crt
On OpenShift: The Kiali Operator (or Helm chart) automatically creates a separate ConfigMap named kiali-cabundle-openshift for the OpenShift service CA, then uses a projected volume to combine it with your custom kiali-cabundle ConfigMap. You only need to create/manage kiali-cabundle with your ACM CA - the system handles merging.
For more details about CA bundle configuration, see TLS Configuration.
Step 4: Get Observatorium API URL
Find the external Observatorium API route URL:
oc get route observatorium-api \
  -n open-cluster-management-observability \
  -o jsonpath='https://{.spec.host}/api/metrics/v1/default'
The URL format is: https://observatorium-api-<namespace>.<apps-domain>/api/metrics/v1/default
Using Kiali Operator (Kiali CR):
spec:
  external_services:
    prometheus:
      # Use Observatorium API route
      url: "<observatorium-api-url>"

      auth:
        type: none  # mTLS authentication at TLS layer, no Authorization header
        cert_file: "secret:acm-observability-certs:tls.crt"
        key_file: "secret:acm-observability-certs:tls.key"

      # Enable Thanos proxy mode
      thanos_proxy:
        enabled: true
        retention_period: "14d"
        scrape_interval: "5m"
Using Server Helm Chart:
OBSERVATORIUM_API_URL="$(oc get route observatorium-api -n open-cluster-management-observability -o jsonpath='https://{.spec.host}/api/metrics/v1/default')"

helm install kiali kiali-server \
  --namespace ${KIALI_NAMESPACE} \
  --set external_services.prometheus.url="${OBSERVATORIUM_API_URL}" \
  --set external_services.prometheus.auth.type="none" \
  --set external_services.prometheus.auth.cert_file="secret:acm-observability-certs:tls.crt" \
  --set external_services.prometheus.auth.key_file="secret:acm-observability-certs:tls.key" \
  --set external_services.prometheus.thanos_proxy.enabled="true" \
  --set external_services.prometheus.thanos_proxy.retention_period="14d" \
  --set external_services.prometheus.thanos_proxy.scrape_interval="5m"
Important Configuration Notes
Metrics Latency
ACM collects metrics from each cluster’s Prometheus and pushes to Thanos every 5 minutes (default). This means, by default, there is a 5-6 minute delay before new metrics appear in Kiali. This latency is inherent to ACM’s architecture and applies to all managed clusters.
Note: This interval is configurable via the spec.observabilityAddonSpec.interval field (in seconds) in the MultiClusterObservability CR on the hub cluster.
Initial warm-up period: After deploying a new application, it takes approximately twice the collection interval before data appears in Kiali’s graph and metrics tab. This is because Kiali uses PromQL rate() functions which require at least two data points to compute a result, and with ACM’s collection interval, two data points take at least two collection cycles to accumulate. For example, with the default 5-minute interval, expect a ~10-minute warm-up period. After this initial warm-up, all time ranges in Kiali should display data normally. However, keep in mind that the most recent data visible in Kiali will always be at least one collection interval old, since metrics must complete a full collection cycle before they appear in Thanos.
Thanos Proxy Mode
Enable thanos_proxy when using ACM/Thanos:
external_services:
  prometheus:
    thanos_proxy:
      enabled: true
      retention_period: "14d"  # Should match your ACM Thanos retention
      scrape_interval: "5m"   # Must match ACM's metrics collection interval
When enabled: true, Kiali uses the configured scrape_interval and retention_period values directly, rather than querying Prometheus’s /api/v1/status/config and /api/v1/status/runtimeinfo endpoints to discover them. This is necessary because Thanos does not expose these Prometheus configuration endpoints.
Why these values matter:
scrape_interval: Kiali’s UI uses this value to compute PromQL rate() intervals and query step sizes. The rate interval must be large enough to contain at least two data points for rate() to produce results. With ACM, data points arrive in Thanos at the ACM collection interval (default 5 minutes), not at the local Prometheus scrape interval (typically 15-30 seconds). If scrape_interval is set too low (e.g., “30s”), the computed rate windows will be too narrow to capture two ACM data points, causing Kiali’s metrics tab to show empty charts even though data exists in Thanos.
Critical: Set scrape_interval to match the ACM metrics collection interval (default "5m"), not the local Prometheus scrape interval. The ACM collection interval is configured via spec.observabilityAddonSpec.interval in the MultiClusterObservability CR on the hub cluster. If you have customized this value, set scrape_interval to match.
retention_period: Used to limit time range queries to available data. ACM defaults to 365d retention when spec.advanced.retentionConfig is not explicitly configured in the MultiClusterObservability CR. If using the default, set retention_period to “365d”. If configuring custom retention, use at least 10d minimum (a Thanos requirement for downsampling to function). Always match retention_period to your actual ACM retention configuration. The “14d” value shown in examples here is used for demonstration.
Multi-Cluster Setup
For multi-cluster service mesh deployments with ACM:
1. Metrics Aggregation (Handled by ACM)
ACM automatically aggregates metrics from all managed clusters. Each cluster’s metrics include a cluster label with the cluster name (the metadata.name of the ManagedCluster resource). To get a list of all the clusters managed by ACM, run oc get managedcluster on the hub cluster.
Kiali can filter metrics by cluster using query_scope. The query_scope configuration adds label filters to every Prometheus query:
external_services:
  prometheus:
    # Example 1: Filter to a single cluster
    query_scope:
      cluster: "east-cluster"

    # Example 2: Filter by mesh_id and cluster
    query_scope:
      mesh_id: "mesh-1"
      cluster: "east-cluster"
Each key-value pair in query_scope is added as key="value" to every query. For example, cluster: "east-cluster" adds cluster="east-cluster" to all PromQL queries.
2. Remote Cluster Access (For Workload/Config Data)
While metrics come from ACM’s central Thanos, Kiali still needs direct API access to each cluster for:
- Workload and service discovery
- Istio configuration validation
- Kubernetes resource details
Create remote cluster secrets as described in the multi-cluster setup guide.
3. External Deployment Model
For multi-cluster with ACM, if you deploy Kiali on the hub cluster (or on a separate management cluster), you will typically want to run Kiali in external deployment mode:
clustering:
  ignore_home_cluster: true  # Kiali is external to mesh

kubernetes_config:
  cluster_name: "<management-cluster-name>"  # Unique name for the cluster where Kiali runs
See the External Kiali guide for complete external deployment instructions.
Certificate Management
Automatic Rotation
ACM-issued certificates (stored in the observability-grafana-certs secret in the ACM observability namespace) have 1-year validity and are automatically rotated by ACM before expiration. When certificates are rotated:
- ACM updates the
observability-grafana-certs secret in open-cluster-management-observability namespace
- You must update the
acm-observability-certs secret in Kiali’s namespace with the new certificate data. Options include:
- Kubernetes updates the mounted files in Kiali pod (within 60 seconds after the secret update)
- Kiali automatically uses new certificates on next connection (no pod restart needed)
Using Custom Certificates
If you prefer to use your own certificate infrastructure instead of ACM’s certificates:
- Generate/obtain certificates signed by a CA trusted by ACM Observatorium API
- Configure ACM to trust your CA (consult ACM documentation)
- Create the
acm-observability-certs secret with your certificates
Verification
Check Certificate Configuration
# Verify secret exists
oc get secret acm-observability-certs -n ${KIALI_NAMESPACE}

# Check certificate expiration
oc get secret acm-observability-certs -n ${KIALI_NAMESPACE} \
  -o jsonpath='{.data.tls\.crt}' | base64 -d | \
  openssl x509 -noout -enddate

# Verify CA bundle
oc get configmap kiali-cabundle -n ${KIALI_NAMESPACE} \
  -o jsonpath='{.data.additional-ca-bundle\.pem}' | \
  openssl x509 -noout -subject
Check Kiali Logs
Verify certificates are loaded successfully:
oc logs -n ${KIALI_NAMESPACE} deployment/kiali | grep -i "credential\|certificate"

# Expected output (at "info" log level):
# INF Loaded [1] valid CA certificate(s) from [/kiali-cabundle/additional-ca-bundle.pem]
#
# Additional output (at "debug" log level):
# DBG Credential file path configured: [/kiali-override-secrets/prometheus-cert/tls.crt]
# DBG Credential file path configured: [/kiali-override-secrets/prometheus-key/tls.key]
Test Metrics
- Generate mesh traffic in one of your managed clusters
- Wait for the initial warm-up period (approximately twice the ACM collection interval; default ~10 minutes) for metrics to propagate to Thanos and for enough data points to accumulate for rate calculations. The graph may appear sooner (after ~5 minutes).
- Access Kiali UI and navigate to a workload
- Verify metrics appear in the Metrics tab and traffic graph
Ambient Mode: If you are using Ambient mode:
- Ztunnel-only traffic (no waypoint): You’ll see TCP metrics and traffic edges in the graph, but HTTP details (response codes, latency) will not be available.
- Traffic through waypoints: You’ll see full L7 metrics, same as sidecar mode.
Verify Metrics in Thanos Directly
Test that metrics exist in Thanos (from within the hub cluster). The following are different queries you can run to obtain metrics data from the backend metric datastore used by ACM.
Note: These commands use jq to format JSON output. If you don’t have jq installed, simply omit | jq . to see the full, unfiltered and raw JSON.
# List available metric names (Kiali uses istio_*, pilot_*, and envoy_* metrics)
oc get --raw "/api/v1/namespaces/open-cluster-management-observability/services/http:observability-thanos-query-frontend:9090/proxy/api/v1/label/__name__/values" | jq -r '.data[] | select(startswith("istio_") or startswith("pilot_") or startswith("envoy_"))'

# Count timeseries for key Istio metrics (shows which metrics have data and how many unique timeseries)
oc get --raw "/api/v1/namespaces/open-cluster-management-observability/services/http:observability-thanos-query-frontend:9090/proxy/api/v1/query?query=count%20by%20(__name__)%20({__name__=~%22istio_requests_total|istio_tcp.*total%22})" | jq -r '.data.result[] | "\(.metric.__name__): \(.value[1])"'

# Query Istio request metrics with full details (limited to first result to show structure)
oc get --raw "/api/v1/namespaces/open-cluster-management-observability/services/http:observability-thanos-query-frontend:9090/proxy/api/v1/query?query=istio_requests_total" | jq '.data.result |= .[0:1]'
Troubleshooting
Empty Graph or No Metrics
Symptom: Kiali shows an empty graph, “No metrics” in the metrics tab, or both.
Causes and Solutions:
-
scrape_interval too low: If thanos_proxy.scrape_interval is set lower than the ACM collection interval (e.g., “30s” instead of “5m”), Kiali’s rate calculations will use windows too narrow to capture enough data points from Thanos
- Solution: Set
thanos_proxy.scrape_interval to match the ACM collection interval (default “5m”). See Thanos Proxy Mode for details
-
Still in warm-up period: After deploying a new application, it takes approximately twice the ACM collection interval (~10 minutes by default) before enough data points exist for rate calculations
- Solution: Wait for the warm-up period to elapse
-
Metrics not allowlisted: ACM doesn’t collect metrics by default
- Solution: Create
observability-metrics-custom-allowlist ConfigMap with uwl_metrics_list.yaml key in source namespace
-
PodMonitor missing: Prometheus not scraping Istio data plane components
- Solution: Create
istio-proxies-monitor PodMonitor in each mesh namespace (including the ztunnel namespace and namespaces with waypoint proxies if using Ambient mode)
-
UWM not enabled: User Workload Monitoring not configured
- Solution: Enable
enableUserWorkload: true in cluster-monitoring-config ConfigMap in openshift-monitoring namespace
-
Missing source/destination labels: The graph builds its topology from workload and namespace labels in the metrics. Verify Istio metrics have proper labels
-
Namespace not selected: Ensure the namespace is selected in the graph’s namespace dropdown
-
Query scope mismatch: Check query_scope cluster names match actual cluster label values
See also the Why is my graph empty? FAQ for additional troubleshooting information.
TLS/Certificate Errors
Symptom: Kiali logs show “x509: certificate signed by unknown authority” or “tls: bad certificate”
Solutions:
-
Verify CA bundle: Ensure kiali-cabundle ConfigMap has the correct CA
oc get configmap kiali-cabundle -n ${KIALI_NAMESPACE} -o yaml
-
Check certificate chain: Verify client cert is signed by expected CA
oc get secret acm-observability-certs -n ${KIALI_NAMESPACE} \
  -o jsonpath='{.data.tls\.crt}' | base64 -d | \
  openssl x509 -noout -issuer
-
Verify projected volume: Check both ConfigMaps are mounted
oc exec -n ${KIALI_NAMESPACE} deploy/kiali -- ls -la /kiali-cabundle/
# Should show: additional-ca-bundle.pem, service-ca.crt
Connection Refused / Timeout
Symptom: Kiali cannot reach Observatorium API
Solutions:
- Verify route exists:
oc get route observatorium-api -n open-cluster-management-observability
- Check ACM is ready (should return “True”):
oc get mco observability -o jsonpath='{.status.conditions[?(@.type=="Ready")].status}{"\n"}'
- Test connectivity (should return “OK”):
oc get --raw "/api/v1/namespaces/open-cluster-management-observability/services/http:observability-thanos-query-frontend:9090/proxy/-/ready"
- Check NetworkPolicies: Ensure no policies block egress from Kiali’s namespace
Ambient Mode: No HTTP Metrics
Symptom: Ambient mode workloads show TCP traffic in Kiali but no HTTP metrics (response codes, latency)
Possible causes:
-
No waypoint deployed: Ztunnel only provides L4 (TCP) metrics. Deploy a waypoint proxy for L7 (HTTP) visibility.
-
Missing waypoint PodMonitor: Even with a waypoint, metrics won’t be collected without a PodMonitor:
- Verify waypoint pod exists:
oc get pods -n <namespace> -l gateway.networking.k8s.io/gateway-class-name=istio-waypoint
- Create PodMonitor in the waypoint’s namespace (same config as sidecar PodMonitor)
-
Missing allowlist in waypoint namespace: Create a ConfigMap with the name observability-metrics-custom-allowlist in the namespace where the waypoint runs (see Metrics Allowlist Configuration)
Ambient Mode: No Ztunnel Metrics
Symptom: Ambient mode workloads show no traffic at all in Kiali
Possible causes:
- Missing ztunnel PodMonitor: Create
istio-proxies-monitor PodMonitor in the ztunnel namespace
- Wrong ztunnel namespace: Verify ztunnel location:
oc get pods -l app=ztunnel -A
- Missing allowlist: Create a ConfigMap with the name
observability-metrics-custom-allowlist in the ztunnel namespace (see Metrics Allowlist Configuration)
Reference
This example represents a fully configured Kiali installation using ACM Observability via the Observatorium API with mTLS:
apiVersion: kiali.io/v1alpha1
kind: Kiali
metadata:
  name: kiali
  namespace: <kiali-namespace>
spec:
  clustering:
    ignore_home_cluster: true  # External deployment

  kubernetes_config:
    cluster_name: "<management-cluster-name>"

  external_services:
    prometheus:
      url: "<observatorium-api-url>"

      auth:
        type: none
        cert_file: "secret:acm-observability-certs:tls.crt"
        key_file: "secret:acm-observability-certs:tls.key"

      thanos_proxy:
        enabled: true
        retention_period: "14d"
        scrape_interval: "5m"
Required Kubernetes resources:
---
# mTLS client certificates (from ACM)
# Data extracted from Secret observability-grafana-certs in namespace open-cluster-management-observability
apiVersion: v1
kind: Secret
metadata:
  name: acm-observability-certs
  namespace: <kiali-namespace>
type: Opaque
data:
  tls.crt: <base64-encoded-certificate>  # From observability-grafana-certs secret, tls.crt key
  tls.key: <base64-encoded-key>          # From observability-grafana-certs secret, tls.key key

---
# Server CA trust (from ACM)
# Data extracted from Secret observability-client-ca-certs (or observability-server-ca-certs) in namespace open-cluster-management-observability
apiVersion: v1
kind: ConfigMap
metadata:
  name: kiali-cabundle
  namespace: <kiali-namespace>
data:
  additional-ca-bundle.pem: |
    -----BEGIN CERTIFICATE-----
    <ACM Observability CA certificate>  # From ca.crt or tls.crt key (see Step 2 for extraction commands)
    -----END CERTIFICATE-----
Additional Resources
7.2 - External Kiali
Deploy Kiali on a Management Cluster.
Larger mesh deployments may desire to separate mesh operation from mesh observability. This means deploying Kiali, and potentially other observability tooling, away from the mesh.
This separation allows for:
- Dedicated management of mesh observability
- Reduced resource consumption on mesh clusters
- Centralized visibility across multiple mesh clusters
- Improved security isolation
Deployment Model
This deployment model requires a minimum of two clusters. The Kiali “home” cluster (where Kiali is deployed) will serve as the “management” cluster. The “mesh” cluster(s) will be where your service mesh is deployed. The mesh deployment will still conform to any of the Istio deployment models that Kiali already supports. The fundamental difference is that Kiali will not be co-located with an Istio control plane, but instead will reside away from the mesh. For multi-cluster mesh deployments, all of the same requirements apply, such as unified metrics and traces, etc.
It can be beneficial to co-locate other observability tooling on the management cluster. For example, co-locating Prometheus will likely improve Kiali’s metric query performance, while also reducing Prometheus resource consumption on the mesh cluster(s). Although, it may require additional configuration, like federating Prometheus databases, etc.
The high-level deployment model looks like this:

Configuration
Configuring Kiali for the external deployment model has the same requirements needed for a co-located Kiali in a multi-cluster installation. Kiali still needs the necessary secrets for accessing the remote clusters.
Additionally, the configuration needs to indicate that Kiali will not be managing its home cluster. This is done in the Kiali CR by setting:
clustering:
  ignore_home_cluster: true
Kiali typically sets its home cluster name to the same cluster name set by the co-located Istio control plane. In an external deployment there is no co-located Istio control plane, and therefore the cluster name must also be set in the configuration. The name must be unique within the set of multi-cluster cluster names.
kubernetes_config:
  cluster_name: <KialiHomeClusterName>
Authorization
The external deployment model currently supports openid, openshift, and anonymous authorization strategies. token auth is untested and considered experimental.
Metrics Aggregation
For external Kiali deployments, you need a unified metrics endpoint that aggregates metrics from all mesh clusters.
7.2.1 - OpenShift
Deploying External Kiali on OpenShift
These are specific notes for the External Kiali deployment model on OpenShift.
Installation
It is highly recommended that the Kiali Operator be deployed on all clusters, even if the Kiali Server itself is not deployed on some clusters. This will ensure that the proper namespace and remote cluster resources can be created. Clusters without a Kiali Server will require only the remote cluster resources necessary for remote Kiali Server authentication. To install these resources, configure the Kiali CR with:
spec.deployment.remote_cluster_resources_only: true
This Kiali CR will result in an installation requiring very limited resources.
Authorization Strategy
When using the openshift authentication strategy on OpenShift, make sure to read and apply any guidance found in the notes for multi-cluster.
8 - Namespace access control
Configuring per-user authorized namespaces.
Introduction
In authentication strategies other than anonymous Kiali supports limiting the
namespaces that are accessible on a per-user basis. The anonymous
authentication strategy does not support this, although you can still limit
privileges when using an OpenShift cluster. See the access control section in
Anonymous strategy.
To authorize namespaces, the standard Roles resources (or ClusterRoles)
and RoleBindings resources (or ClusterRoleBindings) are used.
Kiali can only restrict or grant read access to namespaces as a whole. So,
keep in mind that while the RBAC capabilities of the cluster are used to give
access, Kiali won’t offer the same privilege granularity that the cluster
supports. For example, a user that does not have privileges to get Kubernetes
Deployments via typical tools (e.g. kubectl) would still be able to get
some details of Deployments through Kiali when listing Workloads or when
viewing detail pages, or in the
Graph.
Some features allow creating or changing resources in the cluster (for example,
the Wizards). For these write
operations which may be sensitive, the users will need to have the required
privileges in the cluster to perform updates - i.e. the cluster RBAC takes
effect.
Kiali is going to reject login to users that aren’t authorized to see any namespace.
Granting access to namespaces
In general, Kiali will give read access to namespaces where the logged in
user is allowed to “GET” its definition – i.e. the user is allowed to do a
GET call to the api/v1/namespaces/{namespace-name} endpoint of the cluster
API. Users granted the LIST verb would get access to all namespaces of the
cluster (that’s a GET call to the api/v1/namespaces endpoint of the cluster
API).
You, probably, will want to have this small ClusterRole to help you in
authorizing individual namespaces in Kiali:
apiVersion: rbac.authorization.k8s.io/v1
kind: ClusterRole
metadata:
  name: kiali-namespace-authorization
rules:
- apiGroups: [""]
  resources:
  - namespaces
  - pods/log
  verbs:
  - get
The
pods/log privilege is needed for the
pods Logs view.
Since logs are potentially sensitive, you could remove that privilege if you
don’t want users to be able to fetch pod logs.
Once you have created this ClusterRole, you would authorize a namespace
foobar to user john with the following RoleBinding:
apiVersion: rbac.authorization.k8s.io/v1
kind: RoleBinding
metadata:
  name: authorize-ns-foobar-to-john
  namespace: foobar
subjects:
- kind: User
  name: john
  apiGroup: rbac.authorization.k8s.io
roleRef:
  kind: ClusterRole
  name: kiali-namespace-authorization # The name of the ClusterRole created previously
  apiGroup: rbac.authorization.k8s.io
Note that in this example, the subject kind is User, which is the case when
using openid or openshift authentication strategies. For other
authentication strategies you would need to adjust the RoleBinding to use the
right subject kind.
If you want to authorize a user to access all namespaces in the cluster, the
most efficient way to do it is by creating a ClusterRole with the list verb
for namespaces and bind it to the user using a ClusterRoleBinding:
apiVersion: rbac.authorization.k8s.io/v1
kind: ClusterRole
metadata:
  name: kiali-all-namespaces-authorization
rules:
- apiGroups: [""]
  resources:
  - namespaces
  - pods/log
  verbs:
  - get
  - list
---
apiVersion: rbac.authorization.k8s.io/v1
kind: ClusterRoleBinding
metadata:
  name: authorize-all-namespaces-to-john
subjects:
- kind: User
  name: john
  apiGroup: rbac.authorization.k8s.io
roleRef:
  kind: ClusterRole
  name: kiali-all-namespaces-authorization
  apiGroup: rbac.authorization.k8s.io
Note that the only addition to the ClusterRole is the list verb in the first rule.
Alternatively, you could also use the previously mentioned
kiali-namespace-authorization rather than creating a new one with the list
privilege, and it will work. However, Kiali will perform better if you grant the
list privilege.
Please read your cluster RBAC documentation to learn more about the
authorization system.
Granting write privileges to namespaces
Changing resources in the cluster can be a sensitive operation. Because of
this, the logged in user will need to be given the needed privileges to perform
any updates through Kiali. The following ClusterRole contains all read and write
privileges that may be used in Kiali:
apiVersion: rbac.authorization.k8s.io/v1
kind: ClusterRole
metadata:
  name: kiali-write-privileges
rules:
- apiGroups: [""]
  resources:
  - namespaces
  - pods
  - replicationcontrollers
  - services
  verbs:
  - patch
- apiGroups: ["extensions", "apps"]
  resources:
  - daemonsets
  - deployments
  - replicasets
  - statefulsets
  verbs:
  - patch
- apiGroups: ["batch"]
  resources:
  - cronjobs
  - jobs
  verbs:
  - patch
- apiGroups:
  - networking.istio.io
  - security.istio.io
  - extensions.istio.io
  - telemetry.istio.io
  - gateway.networking.k8s.io
  resources: ["*"]
  verbs:
  - get
  - list
  - watch
  - create
  - delete
  - patch
If needed, you can reduce the set of write privileges to prevent users from changing
unwanted resources. However read privileges are require to read the resources.
Similarly to giving access to namespaces, you can either use a RoleBinding to
give read and write privileges only to specific namespaces, or use a
ClusterRoleBinding to give privileges to all namespaces.
9 - Namespace Management
Configuring the namespaces accessible and visible to Kiali.
Introduction
The default Kiali installation gives Kiali access to all namespaces available in the cluster and will allow all namespaces to be visible.
It is possible to restrict Kiali so that it can only access a specific set of namespaces by providing discovery selectors that match those namespaces. Note that Kiali will not use Istio’s discovery selectors; if Istio has been configured with its own discovery selectors, you will likely want to configure Kiali with the same list of discovery selectors.
This documentation makes a distinction between accessible and visible namespaces. The Kiali Server will be given permission to access either (a) all, or (b) a configured subset, of cluster namespaces. The Kiali Server will only be aware of, query for, and access resources within these accessible namespaces. The set of namespaces visible to an end user, via the Kiali UI, will be a subset of the accessible namespaces. In other words, the namespaces visible to a user may be all, or just some of the namespaces accessible to the Kiali Server.
As of Kiali 2.0, the following settings are no longer supported:
- deployment.accessible_namespaces
- api.namespaces.exclude
- api.namespaces.include
- api.namespaces.label_selector_exclude
- api.namespaces.label_selector_include
Cluster Wide Access Mode
By default, the Kiali Server is given cluster-wide access to all namespaces on the local cluster. This is controlled by the Kiali CR setting deployment.cluster_wide_access, which has a default value of true when not specified.
You cannot have multiple Kiali Servers with both cluster-wide access and identical instance names. If you wish to install multiple Kiali Servers with cluster-wide access enabled, each must have a unique deployment.instance_name value.
In order to restrict the Kiali Server so that it only has access to certain namespaces on the local cluster, it must first have its cluster-wide access disabled. You do this by setting deployment.cluster_wide_access to false in the Kiali CR.
You can still use discovery selectors (explained below) to limit what Kiali will make visible in the UI while cluster_wide_access remains true. You would want to do this for the performance benefits it provides the Kiali Server. But with this, the Kiali Server will be granted ClusterRole permissions rather than individual Role permissions per namespace. In other words, it will have access to all namespaces, but will not make all of them visible.
Accessible Namespaces
With cluster-wide access disabled, the Kiali Server must be told what namespaces are accessible to it. These accessible namespaces are defined by a list of discovery selectors that match namespaces.
The list of accessible namespaces is specified in the Kiali CR via the deployment.discovery_selectors.default setting. As an example, if Kiali is to be installed in the istio-system namespace, and is expected to monitor all namespaces with the label “my-mesh”, the setting would be:
spec:
  deployment:
    cluster_wide_access: false
    discovery_selectors:
      default:
      - matchExpressions:
        - key: my-mesh
          operator: Exists
When cluster_wide_access is set to false, the Kiali Operator will examine the default selectors under spec.deployment.discovery_selectors, as the example above illustrates. The Kiali Operator will then attempt to find all of the namespaces that match the discovery selectors. For each namespace that matches the discovery selectors, the Kiali Operator will create a Role and assign that Role to the Kiali Service Account thus giving Kiali access to those namespaces. These namespaces are therefore called the “accessible namespaces”.
The Kiali Operator will always give the Kiali Server access to the namespace where the Kiali Server is installed, whether its namespace matches a discovery selector or not. When cluster_wide_access is false and no discovery selectors are defined, the Kiali Server will only be given access to its namespace.
Because the Kiali Server utilizes Kubernetes watches to watch all accessible namespaces, this may cause performance issues. To increase performance you can set deployment.cluster_wide_access to true even when specifying a list of discovery selectors. When you do this, the Kiali Server will be given access to the entire cluster and thus it can use a single cluster watch which increases performance and efficiency. However, you must be aware that when you do this, the Kiali Server will be granted access to the cluster via a ClusterRole - individual Roles will not be created per namespace. The spec.deployment.discovery_selectors will still be used to determine which namespaces can be visible to users.
If you install Kiali using the Server Helm Chart, these Roles will be created when cluster_wide_access=false. However, the Server Helm Chart does not provide the same lifecycle management features as the operator:
- The operator automatically cleans up Roles/RoleBindings from namespaces that are no longer accessible when discovery selectors (
deployment.discovery_selectors.default) change
- The operator handles transitions when
view_only_mode or auth.strategy settings change (RoleBindings are immutable and must be deleted/recreated)
- The operator explicitly cleans up ClusterRole/ClusterRoleBinding resources when switching from
cluster_wide_access=true to false
- The operator adds labels to accessible namespaces to mark which Kiali instance manages them
With the Server Helm Chart, you may need to manually clean up resources when changing these configurations. For full lifecycle management, use the operator. The Server Helm Chart is provided only as a convenience.
If you install the Kiali Operator using the
Operator Helm Chart, to be able to use
cluster_wide_access=true, you must specify the
--set clusterRoleCreator=true flag when invoking
helm install.
When installing multiple Kiali instances into a single cluster, deployment.discovery_selectors.default must be mutually exclusive. In other words, a namespace must be matched by the discovery selectors defined by one and only one Kiali CR on the cluster.
Istio Discovery Selectors
In Istio’s MeshConfig, a list of discovery selectors can be configured. These Istio discovery selectors define the namespaces that Istio will consider “in the mesh” (see this blog post for details). These Istio discovery selectors are utilized only by Istio; they will be ignored by Kiali.
Operator Namespace Watching
Note that the discovery selectors are evaluated by the Kiali Operator at install time when deciding which namespaces should be accessible (and thus which Roles to create). Namespaces that do not exist at the time of install will not be accessible to Kiali until the operator has a chance to reconcile the Kiali CR. There are several ways in which the operator can be told to reconcile a Kiali CR in order to determine the new set of accessible namespaces.
- You can ask the Kiali Operator to periodically reconcile the Kiali CR on a fixed schedule. See the Ansible Operator SDK documentation describing the reconcile-period annotation. In short, you can have the Kiali Operator periodically reconcile a Kiali CR by setting the
ansible.sdk.operatorframework.io/reconcile-period annotation on the Kiali CR. For example, to reconcile this Kiail CR every 60 seconds:
metadata:
  kind: Kiali
  annotations:
    ansible.sdk.operatorframework.io/reconcile-period: 60s
- Modifying the
deployment.discovery_selectors.default list of discovery selectors will automatically trigger the Kiali Operator to reconcile a Kiali CR and discover new namespaces. In fact, touching any spec field in the Kiali CR will trigger a reconciliation of the Kiali CR.
- Similar to the above, touching any annotation on the Kiali CR will also trigger a reconciliation. One suggestion is to dedicate an annotation whose purpose is solely to trigger operator reconcilations. For example, add or modify the “trigger-reconcile” annotation on the Kiali CR to trigger the operator to run a reconcilation on that Kiali CR:
kubectl annotate kiali my-kiali-cr --namespace istio-system --overwrite trigger-reconcile="$(date)"
- The Kiali Operator can be enabled to watch for namespaces getting created in the cluster. When new namespaces are created, the Kiali Operator will detect this and will then attempt to reconcile all Kiali CRs in the cluster. To enable operator namespace watching, see the FAQ describing the operator WATCHES_FILE environment variable. Note that on clusters with large numbers of namespaces that get created, enabling this namespace watching feature can cause the operator to consume a lot of CPU, so you may not wish to use this method.
Once the Kiali Operator is triggered to reconcile a Kiali CR, the operator will create the necessary Roles for all accessible namespaces, giving the Kiali Server access to any new namespaces that have been created since the last reconciliation.
Multi-Cluster Environments
The Kiali CR deployment.discover_selectors section supports multi-cluster configurations.
The default discovery selectors define the namespaces on the local cluster that Kiali will have access to (as explained above). These namespaces are made visible to Kiali users.
It is assumed Kiali will have access to the same set of namespaces on the remote clusters as well. So Kiali will make those remote namespaces visible to users. However, if a remote cluster has a different set of namespaces that should be visible to Kiali users, you can set discovery selector overrides in deployment.discovery_selectors to match those remote namespaces.
Each remote cluster overrides section completely overrides the default discovery selectors. That is to say, if a remote cluster has discovery selector overrides defined, only those selectors are used to determine which remote namespaces are to be visible to users. The default discovery selectors will not be used for a particular remote cluster when overrides are defined for that remote cluster.
Here is an example of defining discovery selectors for a remote cluster:
spec:
  deployment:
    cluster_wide_access: false
    discovery_selectors:
      # define accessible namespaces on the local cluster
      default:
      - matchExpressions:
        - key: my-mesh
          operator: Exists
      overrides:
        # My remote cluster has a different set of namespaces
        my-remote-cluster:
        - matchLabels:
            org: production
        - matchExpressions:
          - key: region
            operator: In
            values: ["east"]
You can define overrides for multiple remote clusters:
spec:
  deployment:
    cluster_wide_access: false
    discovery_selectors:
      default:
      - matchLabels:
          region: south
      overrides:
        cluster1:
        - matchLabels:
            region: east
        cluster2:
        - matchLabels:
            region: west
        cluster3:
        - matchLabels:
            region: north
Discovery Selectors
The default and overrides discovery selectors are processed in the same manner. They follow the same semantics as Istio as described in the Istio discoverySelectors documentation
An empty list of discovery selectors has different semantics depending on the value of deployment.cluster_wide_access.
- If
deployment.cluster_wide_access is true, an empty list of discovery selectors means all namespaces will be visible except those that are considered system namespaces. These include namespaces whose names are prefixed with “kube-”, “openshift” or “ibm” such as kube-system, openshift-operators, and ibm-system. (Kubernetes has reserved all namespaces prefixed with kube- as system namespaces and users are cautioned against creating them). System namespaces such as these should not be considered to have service mesh components and so are excluded by Kiali. If, for some reason, you want to consider these namespaces in your service mesh, you can do so by defining discovery selectors, or alternatively you can rename your namespaces so they do not resemble system namespaces.
- If
deployment.cluster_wide_access is false, an empty list of discovery selectors means only the Kiali deployment namespace will be accessible. This is not particularly useful as it will not include any application namespaces.
The Kiali deployment namespace will always be made accessible by Kiali. It is required that Istio control plane namespaces are also accessible. Istio control plane namespace(s) not co-located with Kiali must have their namespaces included in the defined discovery selectors.
In short, the default discovery selectors and each remote cluster overrides are lists of equality-based and set-based label selectors, with each item in a list being disjunctive (that is, match results from each selector item in a selector list are OR’ed together).
Each discovery selector list item itself can consist of one matchLabels, one matchExpressions, or both. A matchLabels can match one or more labels; a matchExpressions can match one or more expressions. All results within a single discovery selector list item are AND’ed together (that is to say, a namespace must match all label selector conditions in order for that namespace to be selected by that label selector).
For details on equality-based and set-based selector syntax and semantics, see the Kubernetes documentation.
Below are a couple of examples to help you understand these semantics.
This defines a discovery selector list that contains a single label selector that consists of one equality-based selector and one set-based selector. The namespaces that match this discovery selector are those that have a env=production label AND a org=frontdesk label AND a app=ticketing label AND a color=blue label:
discovery_selectors:
  default:
  - matchLabels:
      env: production
      org: frontdesk
    matchExpressions:
    - key: app
      operator: In
      values: ["ticketing"]
    - key: color
      operator: In
      values: ["blue"]
Suppose we want to also make accessible all namespaces that have the label region=east. We add another discover selector to the list:
discovery_selectors:
  default:
  - matchLabels:
      region: east
  - matchLabels:
      env: production
      org: frontdesk
    matchExpressions:
    - key: app
      operator: In
      values: ["ticketing"]
    - key: color
      operator: In
      values: ["blue"]
Now all the same namespaces that matched before are also matched. But in addition, all namespaces that simply have a label region=east will also match. This is because both label selectors in the list are OR’ed together.
10 - No Istiod Access
Kiali behavior with no access to Istiod (the /debug endpoints are not available)
Introduction
Kiali makes use of the Istiod /debug endpoints for introspection into the control plane. If this API is unavailable Kiali continues to perform, but the feature set will be degraded. The Istio API can be unavailable for various reasons:
- The Istio API has been explicitly disabled in the Istio configuration.
- The deployment model prevents access to the Istio API (firewalls, other networking concerns or limitations).
- The API is configured but for some, potentially unexpected, reason can not be reached by Kiali.
Configuration
When the Istio API is known to be inaccessible Kiali should be configured via the istio_api_enabled configuration item.
By default, istio_api_enabled is true.
# ...
spec:
external_services:
  istio:
    istio_api_enabled: false
# ...
How does it affect Kiali
When the Istio API is not available there is expected feature degradation in Kiali:
- The control plane metrics won’t be available.
- The proxy status won’t be available in the workloads details view.
- The control plane status will be calculated based on the namespace status, instead of the istio component status.
- The Istio validations may not be available.
- From Kiali >= 2.23, the Kiali validations are available.
Note that Istio Configurations will be available. This is because the list of Istio configurations is obtained using the Kubernetes API.

Istio Validations
The Istio validations won’t be available as this logic is provided by the Istio API.
But, if the Istio Config was created when the validatingwebhookconfiguration web hook was enabled, the validation messages will be available and the Istio validations can be found:
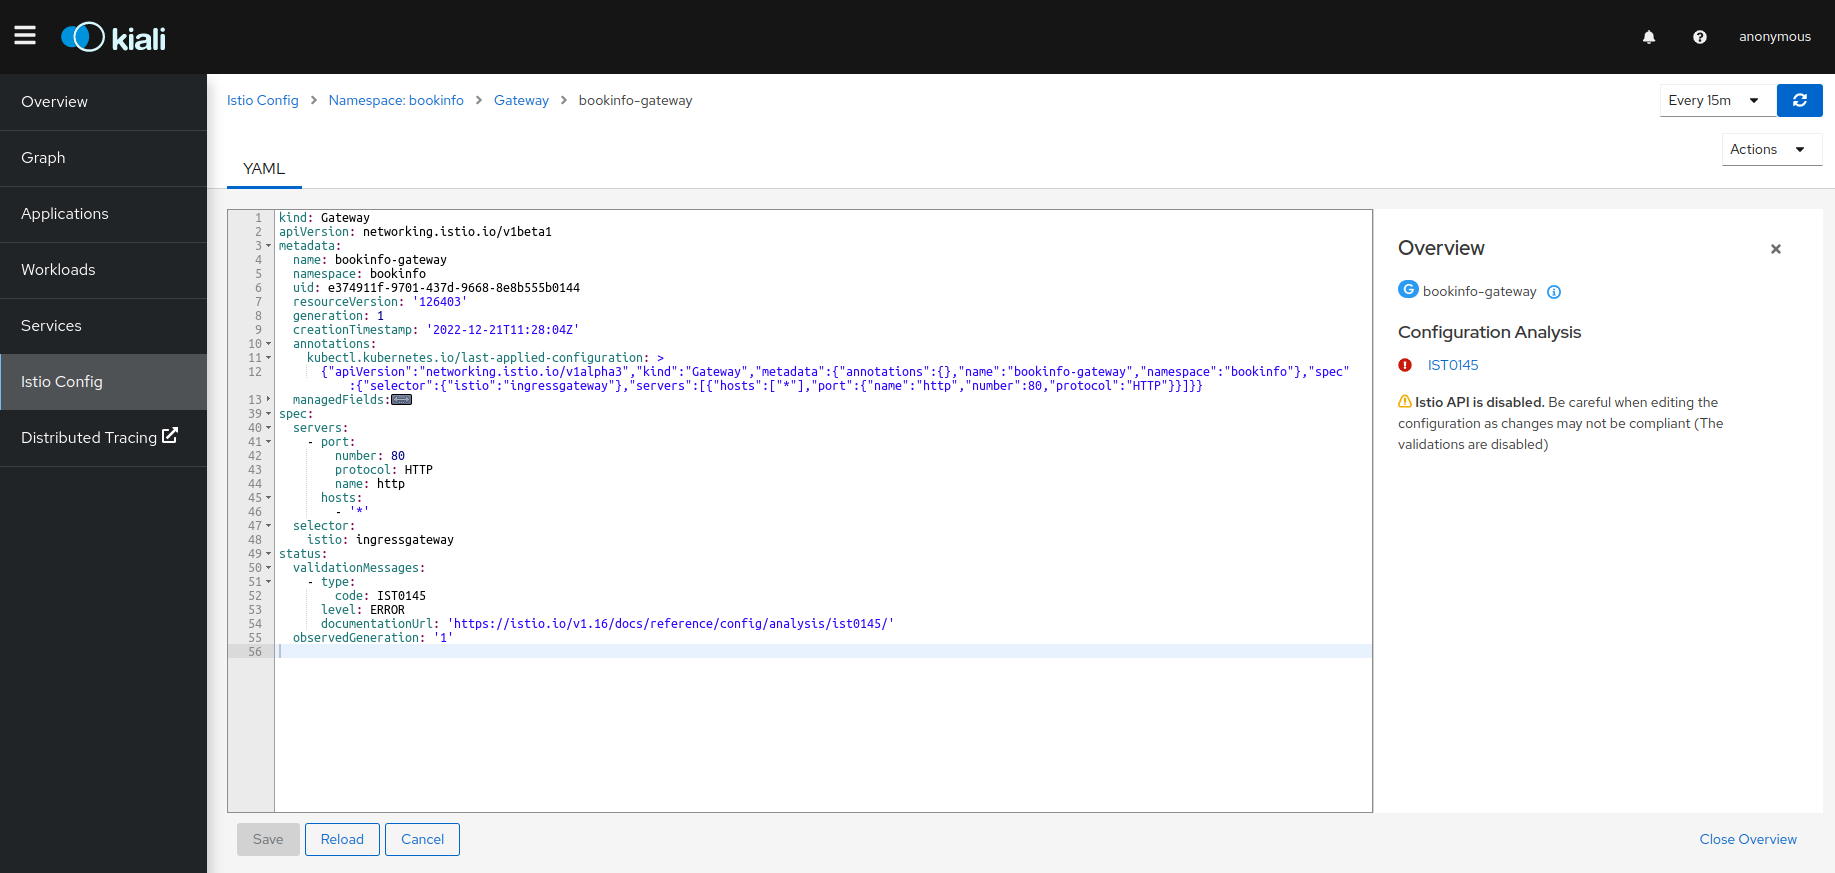
Starting with Kiali 2.23, the Kiali validations are available even when the Istio API is disabled (in earlier versions they were disabled too).
Istio Configurations
The Istio Configurations are available in view and edit mode.
It is important to know that the validations are disabled, so the configurations created or modified won’t be validated.
There is one scenario where the creation/deletion/edition could fail: If the Istio validation webhook is enabled but Istiod is not reachable. In this case, the webhook should be removed in order for this to work.
It can be checked with the following command:
kubectl get ValidatingWebhookConfiguration
11 - OSSMConsole CR Reference
Reference page for the OSSMConsole CR.
The Kiali Operator will watch for a resource of this type and install the OSSM Console plugin according to that resource’s configuration. Only one resource of this type should exist at any one time.
Example CR
(all values shown here are the defaults unless otherwise noted)
apiVersion: kiali.io/v1alpha1
kind: OSSMConsole
metadata:
  name: ossmconsole
  annotations:
    ansible.sdk.operatorframework.io/verbosity: "1"
spec:
  version: "default"

  deployment:
    imageDigest: ""
    imageName: ""
    imagePullPolicy: "IfNotPresent"
    # default: image_pull_secrets is an empty list
    imagePullSecrets: ["image.pull.secret"]
    imageVersion: ""
    namespace: ""

  kiali:
    serviceName: ""
    serviceNamespace: ""
    servicePort: 0
Validating your OSSMConsole CR
The OSSMConsole CR has a CRD Schema so it will be validated when you create or update it in your cluster.
Properties
(object)
This is the CRD for the resources called OSSMConsole CRs. The OpenShift Service Mesh Console Operator will watch for resources of this type and when it detects an OSSMConsole CR has been added, deleted, or modified, it will install, uninstall, and update the associated OSSM Console installation.
(string)
If deployment.imageVersion is a digest hash, this value indicates what type of digest it is. A typical value would be ‘sha256’. Note: do NOT prefix this value with a ‘@’.
(string)
Determines which OSSM Console image to download and install. If you set this to a specific name (i.e. you do not leave it as the default empty string), you must make sure that image is supported by the operator. If empty, the operator will use a known supported image name based on which version was defined. Note that, as a security measure, a cluster admin may have configured the operator to ignore this setting. A cluster admin may do this to ensure the operator only installs a single, specific OSSM Console version, thus this setting may have no effect depending on how the operator itself was configured.
(string)
The Kubernetes pull policy for the OSSM Console deployment. This is overridden to be ‘Always’ if deployment.imageVersion is set to ‘latest’.
(array)
The names of the secrets to be used when container images are to be pulled.
(string)
Determines which version of OSSM Console to install.
Choose ‘lastrelease’ to use the last OSSM Console release.
Choose ‘latest’ to use the latest image (which may or may not be a released version of the OSSM Console).
Choose ‘operator_version’ to use the image whose version is the same as the operator version.
Otherwise, you can set this to any valid OSSM Console version (such as ‘v1.0’) or any valid OSSM Console
digest hash (if you set this to a digest hash, you must indicate the digest in deployment.imageDigest).
Note that if this is set to ‘latest’ then the deployment.imagePullPolicy will be set to ‘Always’.
If you set this to a specific version (i.e. you do not leave it as the default empty string),
you must make sure that image is supported by the operator.
If empty, the operator will use a known supported image version based on which ‘version’ was defined.
Note that, as a security measure, a cluster admin may have configured the operator to
ignore this setting. A cluster admin may do this to ensure the operator only installs
a single, specific OSSM Console version, thus this setting may have no effect depending on how the
operator itself was configured.
(string)
The namespace into which OSSM Console is to be installed. If this is empty or not defined, the default will be the namespace where the OSSMConsole CR is located. Currently the only namespace supported is the namespace where the OSSMConsole CR is located.
(string)
The internal Kiali service that the OpenShift Console will use to proxy API calls. If empty, an attempt will be made to auto-discover it from the Kiali OpenShift Route.
(string)
The namespace where the Kiali service is deployed. If empty, an attempt will be made to auto-discover it from the Kiali OpenShift Route. It will assume that the OpenShift Route and the Kiali service are deployed in the same namespace.
(integer)
The internal port used by the Kiali service for the API. If empty, an attempt will be made to auto-discover it from the Kiali OpenShift Route.
(string)
The version of the Ansible role that will be executed in order to install OSSM Console.
This also indirectly determines the version of OSSM Console that will be installed.
You normally will want to use default since this is the only officially supported value today.
If not specified, the value of default is assumed which means the most recent Ansible role is used;
thus the most recent release of OSSM Console will be installed.
Refer to this file to see what the valid values are for this version field (as defined in the master branch),
https://github.com/kiali/kiali-operator/blob/master/playbooks/ossmconsole-default-supported-images.yml
This version setting affects the defaults of the deployment.imageName and
deployment.imageVersion settings. See the documentation for those settings below for
additional details. In short, this version setting will dictate which version of the
OSSM Console image will be deployed by default. However, if you explicitly set deployment.imageName
and/or deployment.imageVersion to reference your own custom image, that will override the
default OSSM Console image to be installed; therefore, you are responsible for ensuring those settings
are compatible with the Ansible role that will be executed in order to install OSSM Console (i.e. your
custom OSSM Console image must be compatible with the rest of the configuration and resources the
operator will install).
(object)
The processing status of this CR as reported by the OpenShift Service Mesh Console Operator.
12 - Prometheus, Tracing, Grafana
Kiali data sources and add-ons.
Prometheus is a required telemetry data source for Kiali. Jaeger/Tempo is a highly recommended tracing data source. Kiali also offers simple add-on integrations for Grafana and Perses. This page describes how to configure Kiali to communicate with these dependencies.
Read the dedicated configuration page to learn more.
If any of these services use HTTPS with certificates issued by a private CA, see the TLS Configuration page.
12.1 - TLS Configuration
This page describes how to configure TLS certificates for Kiali’s connections to external services.
Overview
When Kiali connects to external services (Prometheus, Grafana, Jaeger/Tempo, Perses) over HTTPS, it needs to verify the TLS certificates presented by those services. By default, Kiali trusts the system certificate authorities (CAs) that are built into the container image.
If your external services use certificates issued by a private CA (such as an internal corporate CA, a service mesh CA, or self-signed certificates), you need to configure Kiali to trust those additional CAs.
Adding Custom Certificate Authorities
Kiali uses a global CA bundle mechanism to trust additional certificate authorities. All custom CAs are added to a single certificate pool that applies to all HTTPS connections Kiali makes to external services.
On Kubernetes
To add custom CAs, create a ConfigMap named <kiali-instance-name>-cabundle in the Kiali namespace. The default instance name is kiali, so the ConfigMap would be named kiali-cabundle:
apiVersion: v1
kind: ConfigMap
metadata:
  name: kiali-cabundle
  namespace: istio-system  # Or your Kiali namespace
data:
  additional-ca-bundle.pem: |
    -----BEGIN CERTIFICATE-----
    MIIDxTCCAq2gAwIBAgIQAqxcJmoLQ...
    ... (your CA certificate) ...
    -----END CERTIFICATE-----
    -----BEGIN CERTIFICATE-----
    MIIDyTCCArGgAwIBAgIRAJ4K...
    ... (additional CA certificates if needed) ...
    -----END CERTIFICATE-----
Key name: The key must be additional-ca-bundle.pem. You can include multiple CA certificates in PEM format in the same file.
Alternative keys: You can also use openid-server-ca.crt or (on OpenShift) oauth-server-ca.crt as key names. While these names suggest specific purposes, all CAs are loaded into Kiali’s global certificate pool and trusted for all TLS connections. Using additional-ca-bundle.pem is recommended for clarity.
For OpenShift OAuth authentication: On OpenShift, you can alternatively create a separate ConfigMap named <instance-name>-oauth-cabundle with the key oauth-server-ca.crt. See the OpenShift authentication documentation for details. However, adding your CA to kiali-cabundle under additional-ca-bundle.pem achieves the same result.
On OpenShift
On OpenShift, the Kiali Operator automatically creates a ConfigMap named <kiali-instance-name>-cabundle-openshift (e.g., kiali-cabundle-openshift) with the annotation service.beta.openshift.io/inject-cabundle: "true". This tells OpenShift to automatically inject the cluster’s service CA into the ConfigMap.
This means that by default, Kiali on OpenShift already trusts:
- The system CAs
- The OpenShift service CA (used by services with serving certificates)
If you need to add additional CAs beyond the OpenShift service CA, create a separate ConfigMap named <kiali-instance-name>-cabundle (e.g., kiali-cabundle):
apiVersion: v1
kind: ConfigMap
metadata:
  name: kiali-cabundle
  namespace: istio-system  # Or your Kiali namespace
data:
  additional-ca-bundle.pem: |
    -----BEGIN CERTIFICATE-----
    MIIDxTCCAq2gAwIBAgIQAqxcJmoLQ...
    ... (your CA certificate) ...
    -----END CERTIFICATE-----
The operator uses a projected volume that automatically combines both ConfigMaps, so your custom CAs work alongside the OpenShift service CA.
How It Works
When Kiali starts, it loads certificates from:
- System certificate pool: The default trusted CAs from the container’s operating system
- Additional CA bundle: Certificates from
/kiali-cabundle/additional-ca-bundle.pem (if present)
- OpenShift service CA (OpenShift only): Certificates from
/kiali-cabundle/service-ca.crt (automatically injected from the <instance-name>-cabundle-openshift ConfigMap)
- OpenID server CA (OpenID auth only): Certificates from
/kiali-cabundle/openid-server-ca.crt (if present)
- OAuth CA bundle (OpenShift with OAuth auth): Certificates from
/kiali-cabundle/oauth-server-ca.crt (if the <instance-name>-oauth-cabundle ConfigMap exists)
All these certificates are combined into a single certificate pool used for all HTTPS connections to external services.
On OpenShift: The operator uses a projected volume that automatically combines multiple ConfigMap sources (<instance-name>-cabundle-openshift, <instance-name>-cabundle, and <instance-name>-oauth-cabundle) into the /kiali-cabundle mount path. This means you don’t need to manually merge ConfigMaps - each ConfigMap can be managed independently.
Automatic refresh: Kiali watches CA bundle files for changes using filesystem notifications (fsnotify) and automatically refreshes the certificate pool without requiring a pod restart. When you update the ConfigMap, Kubernetes propagates the changes to the mounted volume based on the kubelet’s sync interval (default: 60 seconds). Once the files are updated on disk, Kiali detects and applies them immediately. Total propagation time is typically 0-90 seconds after the ConfigMap update.
Skipping Certificate Verification
If you need to temporarily skip certificate verification (for testing purposes only), you can set insecure_skip_verify: true in the authentication configuration for each external service:
spec:
  external_services:
    prometheus:
      auth:
        insecure_skip_verify: true
    grafana:
      auth:
        insecure_skip_verify: true
    tracing:
      auth:
        insecure_skip_verify: true
Security warning: Disabling certificate verification makes Kiali vulnerable to man-in-the-middle attacks. Only use this option for testing purposes, never in production.
Common Scenarios
Internal Corporate CA
If your organization has an internal CA that issues certificates for internal services:
- Obtain the root CA certificate (public part only) from your security team
- Create the ConfigMap with the CA certificate as shown above
Self-Signed Certificates
For development or testing environments using self-signed certificates:
- Export the certificate from your service (usually the same certificate that was generated)
- Create the ConfigMap with that certificate
Istio Service Mesh mTLS
If your external services are part of the Istio service mesh and use Istio’s mTLS:
- Kiali typically accesses these services through their Kubernetes service names, which may bypass the sidecar
- If you need to go through the mesh, you may need to add Istio’s root CA to the bundle
cert-manager Issued Certificates
If you use cert-manager with a private CA:
- The CA certificate is typically stored in a Secret (e.g.,
my-ca-secret with key ca.crt)
- Extract the CA and add it to the ConfigMap:
kubectl get secret my-ca-secret -n cert-manager -o jsonpath='{.data.ca\.crt}' | base64 -d > ca.crt
kubectl create configmap kiali-cabundle -n istio-system --from-file=additional-ca-bundle.pem=ca.crt
Troubleshooting
Certificate Errors in Logs
If you see errors like x509: certificate signed by unknown authority in Kiali logs:
- Verify the ConfigMap exists and has the correct name
- Check that the key is exactly
additional-ca-bundle.pem
- Ensure the certificate is in valid PEM format
- Verify the CA certificate is the correct one (the root or intermediate CA that signed the service’s certificate)
Verifying the ConfigMap is Mounted
Check that the ConfigMap is properly mounted in the Kiali pod:
kubectl exec -n istio-system deploy/kiali -- ls -la /kiali-cabundle/
You should see your CA bundle file listed.
Testing Certificate Chain
To verify your CA certificate is correct, you can test it outside of Kiali:
# Get the server's certificate chain
openssl s_client -connect prometheus.istio-system:9090 -showcerts

# Verify against your CA
openssl verify -CAfile your-ca.pem server-cert.pem
12.2 - Grafana
This page describes how to configure Grafana for Kiali.
Grafana configuration
Istio provides preconfigured Grafana
dashboards for the
most relevant metrics of the mesh. Although Kiali offers similar views in its
metrics dashboards, it is not in Kiali’s goals to provide the advanced querying
options, nor the highly customizable settings, that are available in Grafana.
Thus, it is recommended that you use Grafana if you need those advanced
options.
Kiali can provide a direct link from its metric dashboards to the equivalent or
most similar Grafana dashboard, which is convenient if you need the powerful
Grafana options.
The Grafana links will appear in the Kiali metrics pages. For example:
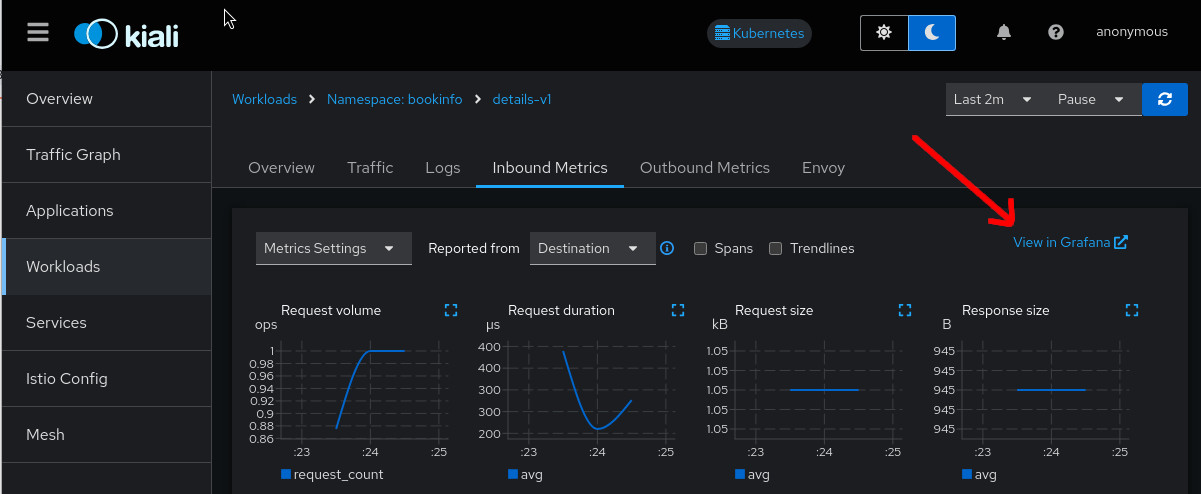
For these links to appear in Kiali you need to manually configure the Grafana URL
and the dashboards that come preconfigured with Istio, like in the following example:
Kiali will query Grafana and try to fetch the configured dashboards. For this reason Kiali must be able to reach Grafana, authenticate, and find the Istio dashboards. The Istio dashboards must be installed in Grafana for the links to appear in Kiali.
spec:
  external_services:
    grafana:
      enabled: true
      # Grafana service name is "grafana" and is in the "telemetry" namespace.
      internal_url: 'http://grafana.telemetry:3000/'
      # Public facing URL of Grafana
      external_url: 'http://my-ingress-host/grafana'
      # Grafana datasource UID when there are multiple
      datasource_uid: ""
      dashboards:
      - name: "Istio Service Dashboard"
        variables:
          datasource: "var-datasource"
          namespace: "var-namespace"
          service: "var-service"
      - name: "Istio Workload Dashboard"
        variables:
          datasource: "var-datasource"
          namespace: "var-namespace"
          workload: "var-workload"
          datasource: "var-datasource"
      - name: "Istio Mesh Dashboard"
      - name: "Istio Control Plane Dashboard"
      - name: "Istio Performance Dashboard"
      - name: "Istio Wasm Extension Dashboard"
The described configuration is done in the Kiali CR when Kiali is installed using the Kiali Operator. If Kiali is installed with the Helm chart then the correct way to configure this is via regular –set flags.
Grafana authentication configuration
The Kiali CR provides authentication configuration that will be used to connect to your Grafana instance and for detecting your Grafana version in the Mesh graph.
spec:
  external_services:
    grafana:
      enabled: true
      auth:
        insecure_skip_verify: false
        password: "pwd"
        token: ""
        type: "basic"
        use_kiali_token: false
        username: "user"
      health_check_url: ""
To configure a secret to be used as a password, see this FAQ entry.
TLS Certificate Configuration
If your Grafana server uses HTTPS with a certificate issued by a private CA, see the TLS Configuration page to learn how to configure Kiali to trust your CA.
12.3 - Perses
This page describes how to configure Perses for Kiali.
Perses configuration
The Perses community dashboards provide preconfigured Perses
dashboards for the
most relevant mesh metrics. Although Kiali offers similar views in its
metrics dashboards, it is not in Kiali’s goals to provide the advanced querying
options, nor the highly customizable settings, that are available in Perses.
They are the same as those provided by Istio’s Grafana add-on.
Thus, it is recommended that you use Perses if you need those advanced
options.
Kiali, from version v2.15, can provide a direct link from its metric dashboards to the equivalent or
most similar Perses dashboard, which is convenient if you need the powerful
Perses options.
The Perses links will appear in the Kiali metrics pages. For example:
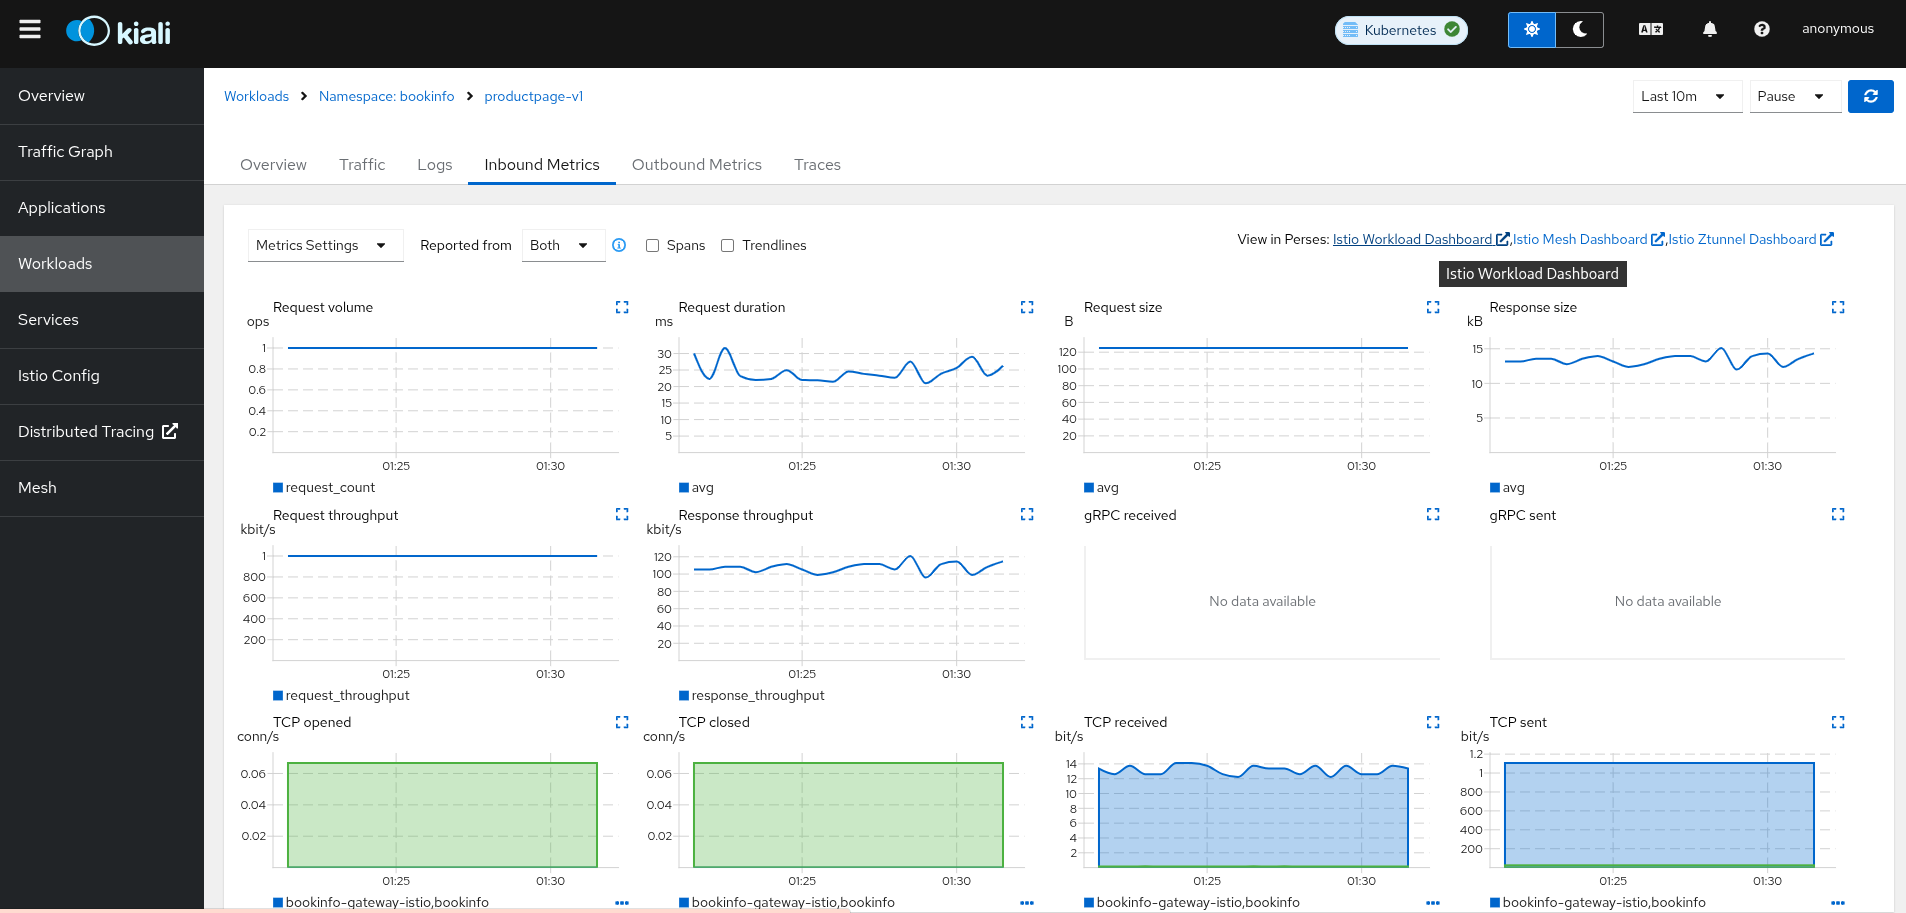
For these links to appear in Kiali you need to manually configure the Perses URL
and the dashboards that come preconfigured with Istio, like in the following example:
Kiali will query Perses and try to fetch the configured dashboards. For this reason Kiali must be able to reach Perses, authenticate, and find the Istio dashboards. The Istio dashboards must be installed in Perses for the links to appear in Kiali.
spec:
  external_services:
    perses:
      enabled: true
      # Perses service name is "perses" and is in the "telemetry" namespace.
      internal_url: 'http://perses.telemetry:4000/'
      # Public facing URL of Perses
      external_url: 'http://my-ingress-host/perses'
      dashboards:
        - name: "Istio Service Dashboard"
          variables:
            namespace: "var-namespace"
            service: "var-service"
            datasource: "var-datasource"
        - name: "Istio Workload Dashboard"
          variables:
            namespace: "var-namespace"
            workload: "var-workload"
        - name: "Istio Mesh Dashboard"

        - name: "Istio Ztunnel Dashboard"
          variables:
            namespace: "var-namespace"
            workload: "var-workload"
      # Perses project
      project: "istio"
The described configuration is done in the Kiali CR when Kiali is installed using the Kiali Operator. If Kiali is installed with the Helm chart then the correct way to configure this is via regular –set flags.
When running Perses with the cluster observability operator in OpenShift, it requires an additional configuration item (Available from Kiali >2.17), so the url format can be compatible with the plugin UI URL:
spec:
  external_services:
    perses:
      ...
      url_format: "openshift"
The internal URL shouldn’t be set to avoid an internal validation of the Dashboards.
The external URL should be set to the OpenShift cluster, without the additional path.
Perses authentication configuration
The Kiali CR provides authentication configuration that will be used to connect to your Perses instance and for detecting your Perses version in the Mesh graph.
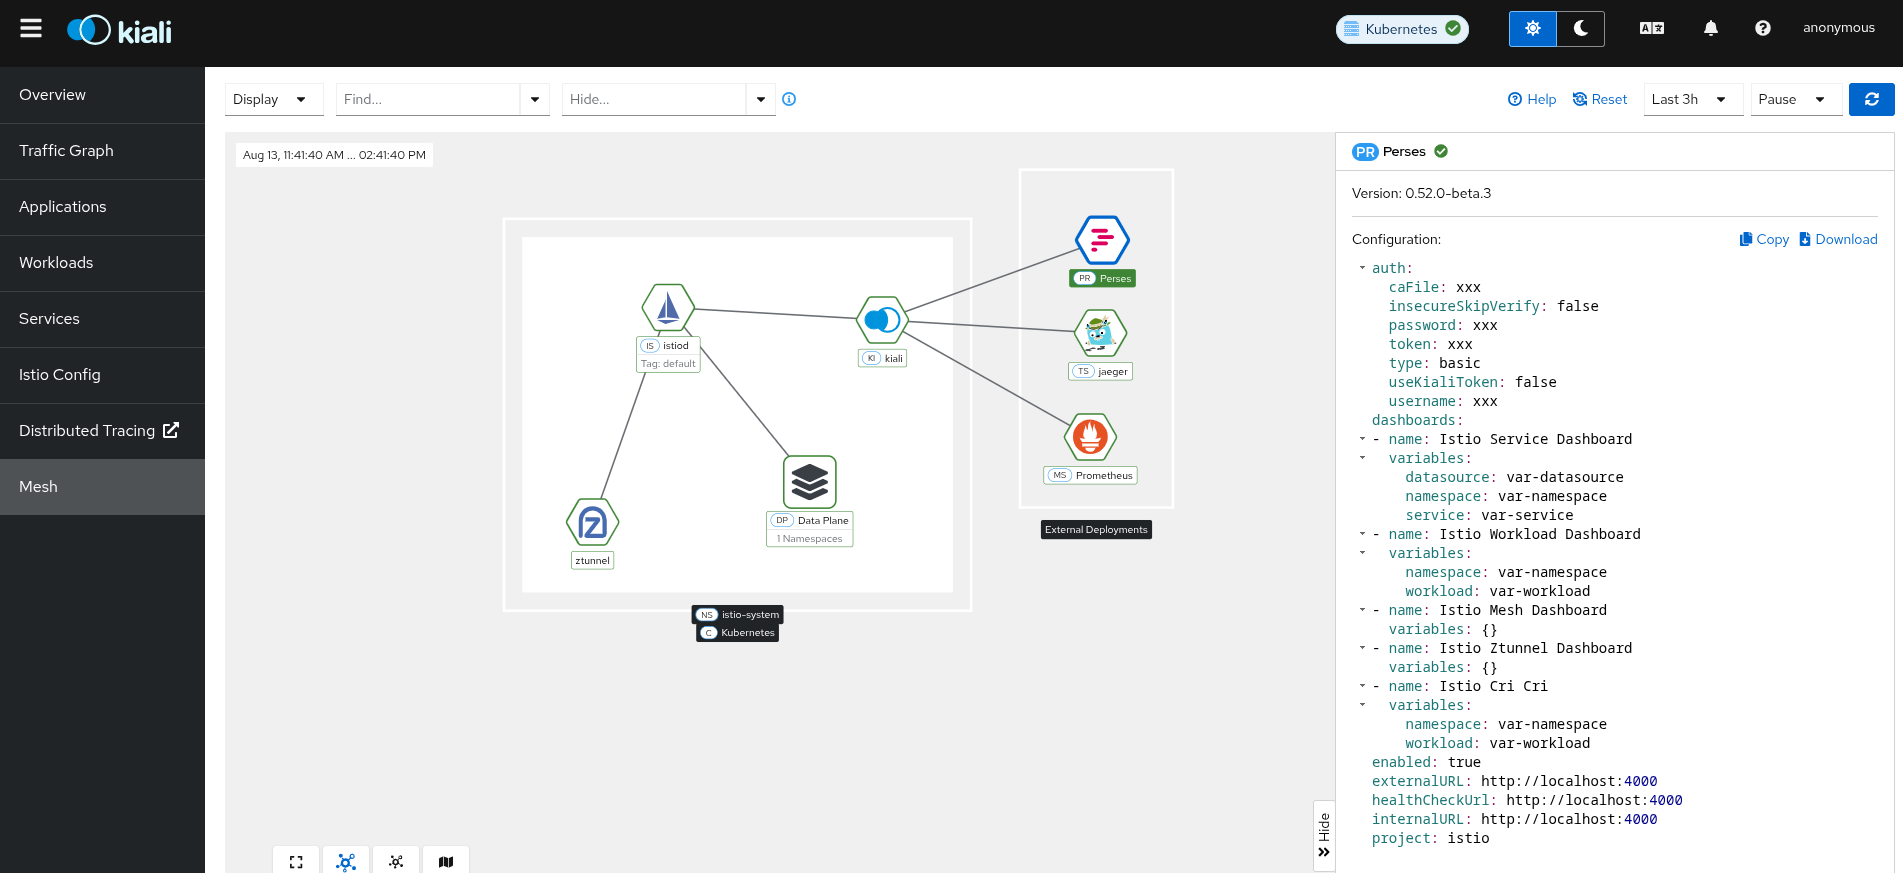
Just basic authentication is supported. This will be configured in Perses as native authentication.
spec:
  external_services:
    perses:
      enabled: true
      auth:
        insecure_skip_verify: false
        password: "pwd"
        type: "basic"
        username: "user"
      health_check_url: ""
To configure a secret to be used as a user or password, see this FAQ entry.
TLS Certificate Configuration
If your Perses server uses HTTPS with a certificate issued by a private CA, see the TLS Configuration page to learn how to configure Kiali to trust your CA.
12.4 - Prometheus
This page describes how to configure Prometheus for Kiali.
Prometheus configuration
Kiali requires Prometheus to generate the
topology graph,
show metrics,
calculate health and
for several other features. If Prometheus is missing or Kiali
can’t reach it, Kiali won’t work properly.
By default, Kiali assumes that Prometheus is available at the URL of the form
http://prometheus.<istio_namespace_name>:9090, which is the usual case if you
are using the Prometheus Istio
add-on.
If your Prometheus instance has a different service name or is installed in a
different namespace, you must manually provide the endpoint where it is
available, like in the following example:
spec:
  external_services:
    prometheus:
      # Prometheus service name is "metrics" and is in the "telemetry" namespace
      url: "http://metrics.telemetry:9090/"
Notice that you don’t need to expose Prometheus outside the cluster. It is
enough to provide the Kubernetes internal service URL.
Kiali maintains an internal cache of some Prometheus queries to improve
performance (mainly, the queries to calculate Health indicators). It
would be very rare to see data delays, but should you notice any delays you may
tune caching parameters to values that work better for your environment.
See the Kiali CR reference page for the current default values.
Compatibility with Prometheus-like servers
Although Kiali assumes a Prometheus server and is tested against it, there are
TSDBs that can be used as a Prometheus
replacement despite not implementing the full Prometheus API.
Community users have faced two issues when using Prometheus-like TSDBs:
- Kiali may report that the TSDB is unreachable, and/or
- Kiali may show empty metrics if the TSBD does not implement the
/api/v1/status/config.
To fix these issues, you may need to provide a custom health check endpoint for
the TSDB and/or manually provide the configurations that Kiali reads from the
/api/v1/status/config API endpoint:
spec:
  external_services:
    prometheus:
      # Fix the "Unreachable" metrics server warning.
      health_check_url: "http://custom-tsdb-health-check-url"
      # Fix for the empty metrics dashboards
      thanos_proxy:
        enabled: true
        retention_period: "7d"
        scrape_interval: "30s"
Prometheus Tuning
Production environments should not be using the Istio Prometheus add-on, or carrying over its configuration settings. That is useful only for small, or demo installations. Instead, Prometheus should have been installed in a production-oriented way, following the Prometheus documentation.
This section is primarily for users where Prometheus is being used specifically for Kiali, and possible optimizations that can be made knowing that Kiali does not utilize all of the default Istio and Envoy telemetry.
Metric Thinning
Istio and Envoy generate a large amount of telemetry for analysis and troubleshooting. This can result in significant resources being required to ingest and store the telemetry, and to support queries into the data. If you use the telemetry specifically to support Kiali, it is possible to drop unnecessary metrics and unnecessary labels on required metrics. This FAQ Entry displays the metrics and attributes required for Kiali to operate.
To reduce the default telemetry to only what is needed by Kiali users can add the following snippet to their Prometheus configuration. Because things can change with different versions, it is recommended to ensure you use the correct version of this documentation based on your Kiali/Istio version.
The metric_relabel_configs: attribute should be added under each job name defined to scrape Istio or Envoy metrics. Below we show it under the kubernetes-pods job, but you should adapt as needed. Be careful of indentation.
    - job_name: kubernetes-pods
      metric_relabel_configs:
      - action: drop
        source_labels: [__name__]
        regex: istio_agent_.*|istiod_.*|istio_build|citadel_.*|galley_.*|pilot_[^psx].*|envoy_cluster_[^u].*|envoy_cluster_update.*|envoy_listener_[^dh].*|envoy_server_[^mu].*|envoy_wasm_.*
      - action: labeldrop
        regex: chart|destination_app|destination_version|heritage|.*operator.*|istio.*|release|security_istio_io_.*|service_istio_io_.*|sidecar_istio_io_inject|source_app|source_version
Applying this configuration should reduce the number of stored metrics by about 20%, as well as reducing the number of attributes stored on many remaining metrics.
Metric Thinning with Crippling
The section above drops metrics unused by Kiali. As such, making those configuration changes should not negatively impact Kiali behavior in any way. But some very heavy metrics remain. These metrics can also be dropped, but their removal will impact the behavior of Kiali. This may be OK if you don’t use the affected features of Kiali, or if you are willing to sacrifice the feature for the associated metric savings. In particular, these are “Histogram” metrics. Istio is planning to make some improvements to help users better configure these metrics, but as of this writing they are still defined with fairly inefficient default “buckets”, making the number of associated time-series quite large, and the overhead of maintaining and querying the metrics, intensive. Each histogram actually is comprised of 3 stored metrics. For example, a histogram named xxx would result in the following metrics stored into Prometheus:
xxx_bucket
- The most intensive metric, and is required to calculate percentile values.
xxx_count
- Required to calculate ‘avg’ values.
xxx_sum
- Required to calculate rates over time, and for ‘avg’ values.
When considering whether to thin the Histogram metrics, one of the following three approaches is recommended:
- If the relevant Kiali reporting is needed, keep the histogram as-is.
- If the relevant Kiali reporting is not needed, or not worth the additional metric overhead, drop the entire histogram.
- If the metric chart percentiles are not required, drop only the xxx_bucket metric. This removes the majority of the histogram overhead while keeping rate and average (non-percentile) values in Kiali.
These are the relevant Histogram metrics:
istio_request_bytes
This metric is used to produce the Request Size chart on the metric tabs. It also supports Request Throughput edge labels on the graph.
- Appending
|istio_request_bytes_.* to the drop regex above would drop all associated metrics and would prevent any request size/throughput reporting in Kiali.
- Appending
|istio_request_bytes_bucket to the drop regex above, would prevent any request size percentile reporting in the Kiali metric charts.
istio_response_bytes
This metric is used to produce the Response Size chart on the metric tabs. And also supports Response Throughput edge labels on the graph
- Appending
|istio_response_bytes_.* to the drop regex above would drop all associated metrics and would prevent any response size/throughput reporting in Kiali.
- Appending
|istio_response_bytes_bucket to the drop regex above would prevent any response size percentile reporting in the Kiali metric charts.
istio_request_duration_milliseconds
This metric is used to produce the Request Duration chart on the metric tabs. It also supports Response Time edge labels on the graph.
- Appending
|istio_request_duration_milliseconds_.* to the drop regex above would drop all associated metrics and would prevent any request duration/response time reporting in Kiali.
- Appending
|istio_request_duration_milliseconds_bucket to the drop regex above would prevent any request duration/response time percentile reporting in the Kiali metric charts or graph edge labels.
Scrape Interval
The Prometheus globalScrapeInterval is an important configuration option. The scrape interval can have a significant effect on metrics collection overhead as it takes effort to pull all of those configured metrics and update the relevant time-series. And although it doesn’t affect time-series cardinality, it does affect storage for the data-points, as well as having impact when computing query results (the more data-points, the more processing and aggregation).
Users should think carefully about their configured scrape interval. Note that the Istio addon for prometheus configures it to 15s. This is great for demos but may be too frequent for production scenarios. The prometheus helm charts set a default of 1m, which is more reasonable for most installations, but may not be the desired frequency for any particular setup.
The recommendation for Kiali is to set the longest interval possible, while still providing a useful granularity. The longer the interval the less data points scraped, thus reducing processing, storage, and computational overhead. But the impact on Kiali should be understood. It is important to realize that request rates (or byte rates, message rates, etc) require a minumum of two data points:
rate = (dp2 - dp1) / timePeriod
That means for Kiali to show anything useful in the graph, or anywhere rates are used (many places), the minimum duration must be >= 2 x globalScrapeInterval. Kiali will eliminate invalid Duration options given the globalScrapeInterval.
Kiali does a lot of aggregation and querying over time periods. As such, the number of data points will affect query performance, especially for larger time periods.
For more information, see the Prometheus documentation.
TSDB retention time
The Prometheus tsdbRetentionTime is an important configuration option. It has a significant effect on metrics storage, as Prometheus will keep each reported data-point for that period of time, performing compaction as needed. The larger the retention time, the larger the required storage. Note also that Kiali queries against large time periods, and very large data-sets, may result in poor performance or timeouts.
The recommendation for Kiali is to set the shortest retention time that meets your needs and/or operational limits. In some cases users may want to offload older data to a secondary store. Kiali will eliminate invalid Duration options given the tsdbRetentionTime.
For more information, see the Prometheus documentation.
Prometheus authentication configuration
The Kiali CR provides authentication configuration that will be used also for querying the version check to provide information in the Mesh graph.
spec:
  external_services:
    prometheus:
      auth:
        insecure_skip_verify: false
        password: "pwd"
        token: ""
        type: "basic"
        use_kiali_token: false
        username: "user"
      health_check_url: ""
To configure a secret to be used as a password, see this FAQ entry.
TLS Certificate Configuration
If your Prometheus server uses HTTPS with a certificate issued by a private CA, see the TLS Configuration page to learn how to configure Kiali to trust your CA.
12.5 - Tracing
Configuration to setup Kiali with Jaeger or Grafana Tempo.
Jaeger is the default tracing provider for Kiali. From Kiali version 1.74, Tempo support is also included. This page describes how to configure Jaeger and Grafana Tempo in Kiali.
12.5.1 - Jaeger
This page describes how to configure Jaeger for Kiali.
Jaeger configuration
Jaeger is a highly recommended service because Kiali uses distributed
tracing data for several features,
providing an enhanced experience.
By default, Kiali will try to reach Jaeger at the GRPC-enabled URL of the form
http://tracing.<istio_namespace_name>:16685/jaeger, which is the usual case
if you are using the Jaeger Istio
add-on.
If this endpoint is unreachable, Kiali will disable features that use
distributed tracing data.
If your Jaeger instance has a different service name or is installed to a
different namespace, you must manually provide the endpoint where it is
available, like in the following example:
spec:
  external_services:
    tracing:
      # Enabled by default. Kiali will anyway fallback to disabled if
      # Jaeger is unreachable.
      enabled: true
      # Jaeger service name is "tracing" and is in the "telemetry" namespace.
      # Make sure the URL you provide corresponds to the non-GRPC enabled endpoint
      # if you set "use_grpc" to false.
      internal_url: "http://tracing.telemetry:16685/jaeger"
      use_grpc: true
      # Public facing URL of Jaeger
      external_url: "http://my-jaeger-host/jaeger"
Minimally, you must provide spec.external_services.tracing.internal_url to
enable Kiali features that use distributed tracing data. However, Kiali can
provide contextual links that users can use to jump to the Jaeger console to
inspect tracing data more in depth. For these links to be available you need to
set the spec.external_services.tracing.external_url to the URL where you
expose Jaeger outside the cluster.
Default values for connecting to Jaeger are based on the
Istio’s provided
sample add-on manifests.
If your Jaeger setup differs significantly from the sample add-ons, make sure
that Istio is also properly configured to push traces to the right URL.
Jaeger authentication configuration
The Kiali CR provides authentication configuration that will be used also for querying the version check to provide information in the Mesh graph.
spec:
  external_services:
    tracing:
      enabled: true
      auth:
        insecure_skip_verify: false
        password: "pwd"
        token: ""
        type: "basic"
        use_kiali_token: false
        username: "user"
      health_check_url: ""
To configure a secret to be used as a password, see this FAQ entry.
TLS Certificate Configuration
If your Jaeger server uses HTTPS with a certificate issued by a private CA, see the TLS Configuration page to learn how to configure Kiali to trust your CA.
12.5.2 - Grafana Tempo
This page describes how to configure Grafana Tempo for Kiali.
Grafana Tempo Configuration
There are two possibilities to integrate Kiali with Grafana Tempo:
Using the Grafana Tempo API
There are two steps to set up Kiali and Grafana Tempo:
Set up the Kiali CR
This is a configuration example to set up Kiali tracing with Grafana Tempo:
spec:
  external_services:
    tracing:
      # Enabled by default. Kiali will anyway fallback to disabled if
      # Tempo is unreachable.
      enabled: true
      health_check_url: "https://tempo-instance.grafana.net"
      # Tempo service name is "query-frontend" and is in the "tempo" namespace.
      # Make sure the URL you provide corresponds to the non-GRPC enabled endpoint
      # It does not support grpc yet, so make sure "use_grpc" is set to false.
      internal_url: "http://tempo-tempo-query-frontend.tempo.svc.cluster.local:3200/"
      provider: "tempo"
      tempo_config:
        org_id: "1"
        datasource_uid: "a8d2ef1c-d31c-4de5-a90b-e7bc5252cd00"
        url_format: "grafana"
      use_grpc: false
      # Public facing URL of Tempo
      external_url: "https://grafana-istio-system.apps-crc.testing/"
Kiali uses the external_url to construct “View in tracing” links in the UI.
For the Tempo provider the default url_format is grafana.
So, by default the URL will have the Grafana UI format when linking to specific services and traces.
It is also possible to set url_format to openshift. In this case the URL will redirect to the UI Plugin in the OpenShift console.
When it is set to openshift, there are other settings as well:
spec:
  external_services:
    tracing:
      tempo_config:
        name: "sample"
        namespace: "tempo"
        tenant: "default"
        url_format: "openshift"
When the tenant is specified, if internal_url doesn’t have a path, it will be autocompleted with the Tempo path. For this example:
internal_url: https://tempo-sample-gateway.tempo.svc.cluster.local:8080/
Will be autocompleted to: https://tempo-sample-gateway.tempo.svc.cluster.local:8080/api/traces/v1/{tenant}/tempo
The other valid option for url_format is jaeger, used when the Jaeger UI is available in Tempo.
Set up a Tempo Datasource in Grafana
We can optionally set up a default Tempo datasource in Grafana so that you can view the Tempo tracing data within the Grafana UI, as you see here:
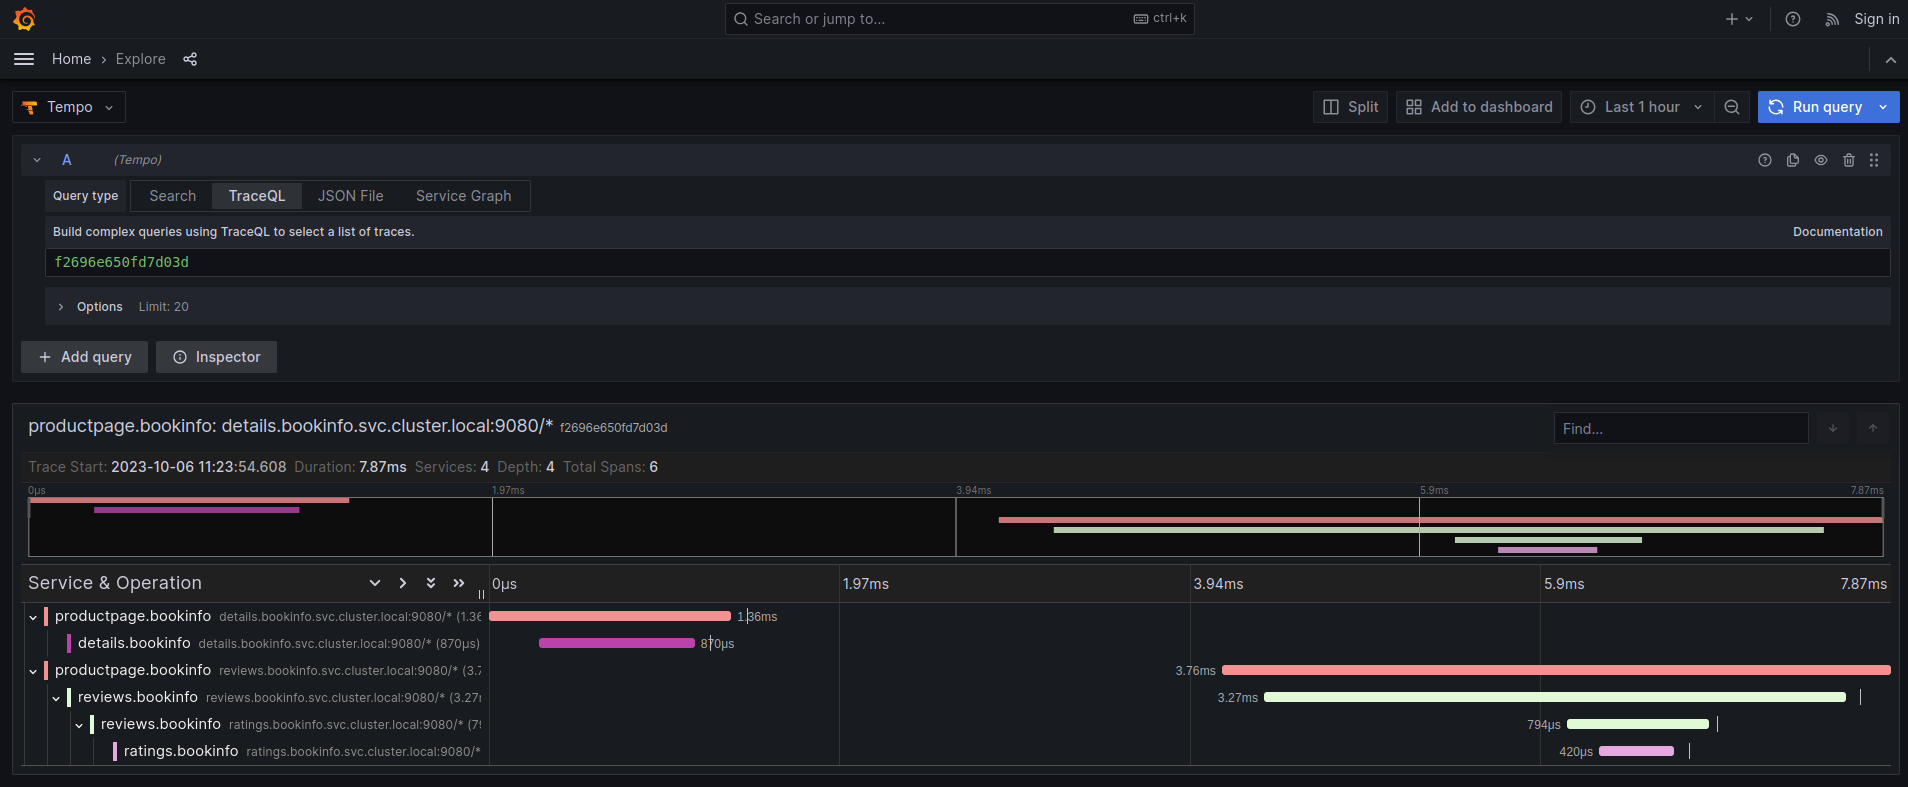
To set up the Tempo datasource, go to the Home menu in the Grafana UI, click Data sources, then click the Add new data source button and select the Tempo data source. You will then be asked to enter some data to configure the new Tempo data source:
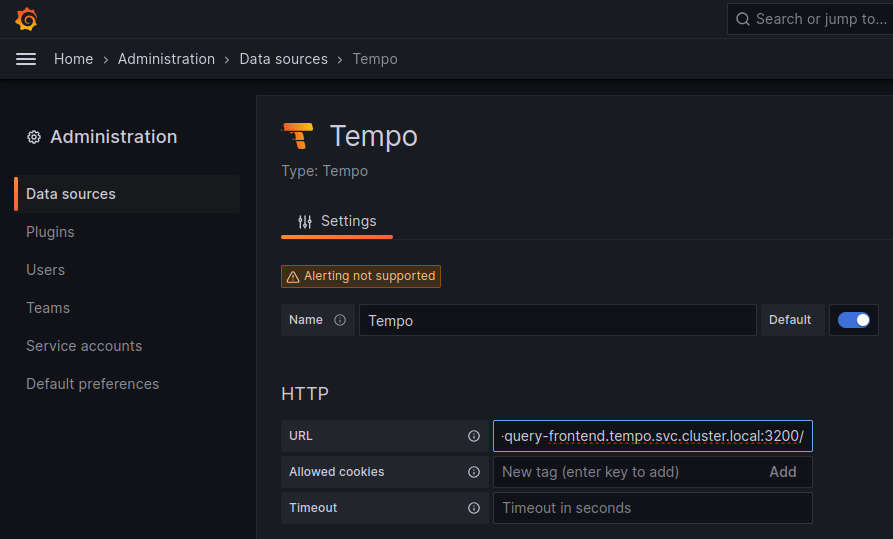
The most important values to set up are the following:
- Mark the data source as default, so the URL that Kiali uses will redirect properly to the Tempo data source.
- Update the HTTP URL. This is the internal URL of the HTTP tempo frontend service. e.g.
http://tempo-tempo-query-frontend.tempo.svc.cluster.local:3200/
Additional configuration
The Traces tab in the Kiali UI will show your traces in a bubble chart:
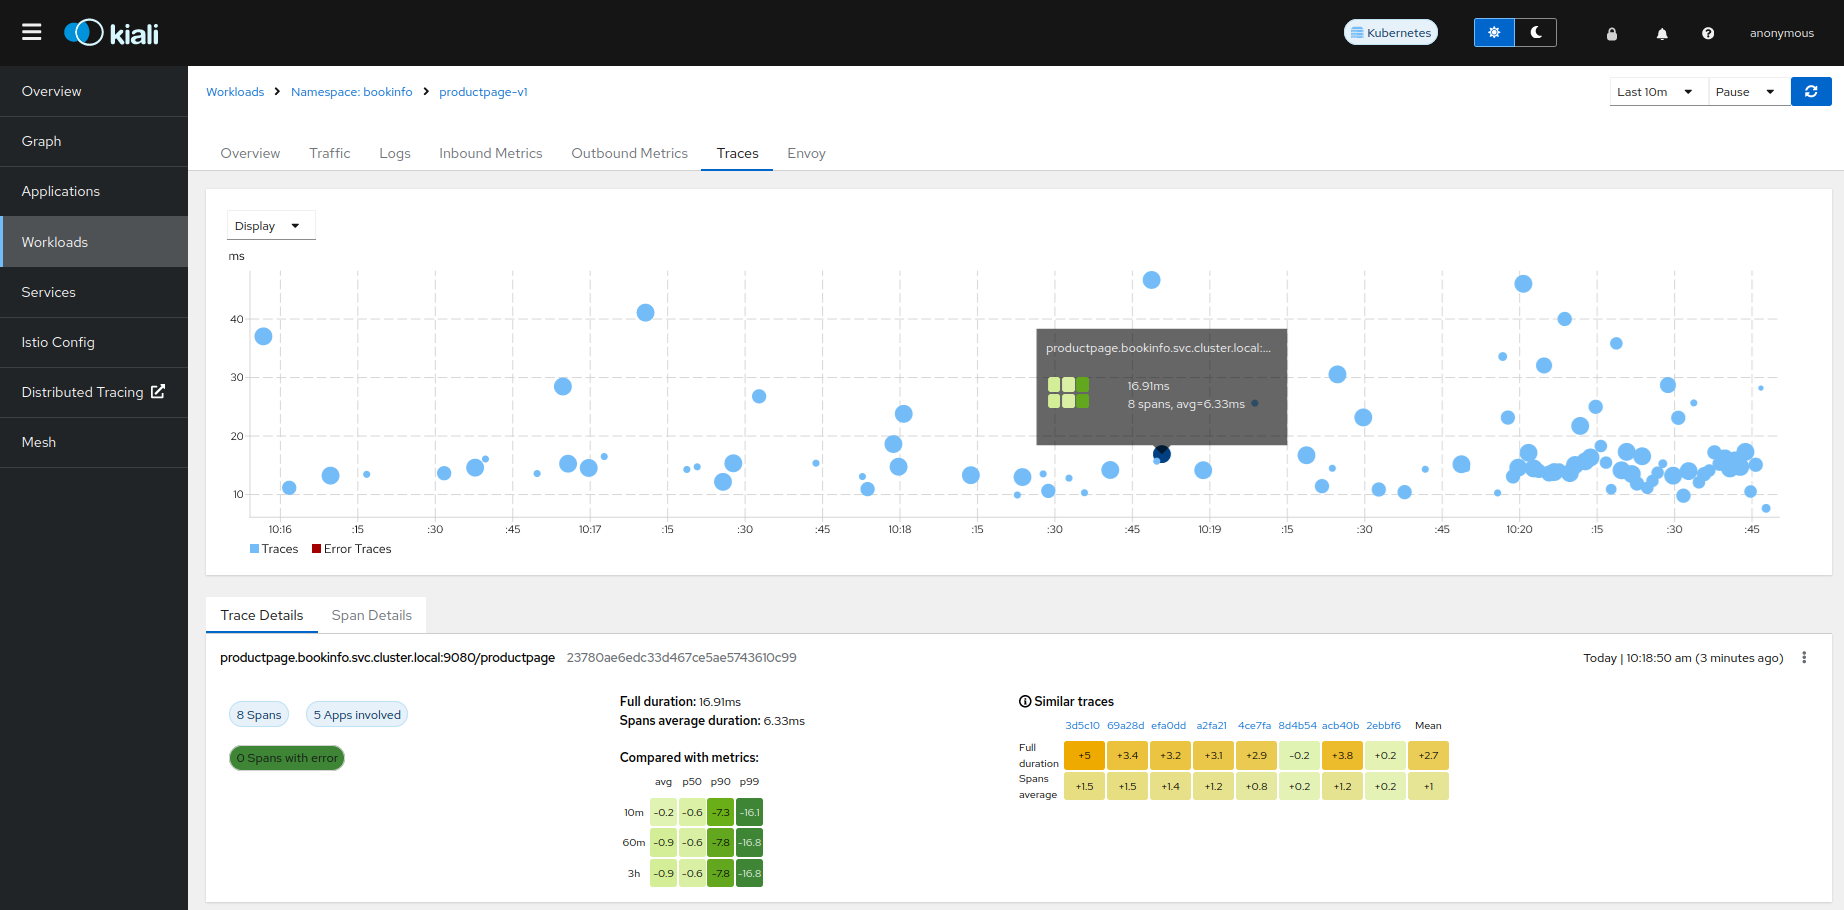
Increasing performance is achievable by enabling gRPC access, specifically for query searches. However, accessing the HTTP API will still be necessary to gather information about individual traces. This is an example to configure the gRPC access:
spec:
  external_services:
    tracing:
      enabled: true
      # grpc port defaults to 9095
      grpc_port: 9095
      internal_url: "http://query-frontend.tempo:3200"
      provider: "tempo"
      use_grpc: true
      external_url: "http://my-tempo-host:3200"
Service check URL
By default, Kiali will check the service health in the endpoint /status/services, but sometimes, this is exposed in a different url, which can lead to a component unreachable message:
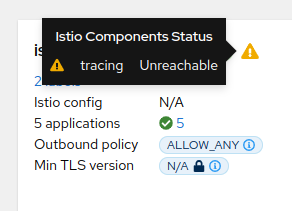
This can be changed with the health_check_url configuration option.
spec:
  external_services:
    tracing:
      health_check_url: "http://query-frontend.tempo:3200"
Configuration for the Grafana Tempo Datasource
In order to correctly redirect Kiali to the right Grafana Tempo Datasource, there are a couple of configuration options to update:
spec:
  external_services:
    tracing:
      tempo_config:
        org_id: "1"
        datasource_uid: "a8d2ef1c-d31c-4de5-a90b-e7bc5252cd00"
org_id is usually not needed since “1” is the default value which is also Tempo’s default org id.
The datasource_uid needs to be updated in order to redirect to the right datasource in Grafana versions 10 or higher.
Using the Jaeger frontend with Grafana Tempo tracing backend
It is possible to use the Grafana Tempo tracing backend exposing the Jaeger API.
tempo-query is a
Jaeger storage plugin. It accepts the full Jaeger query API and translates these
requests into Tempo queries.
Since Tempo is not yet part of the built-in addons that are part of Istio, you
need to manage your Tempo instance.
Tanka
The official Grafana Tempo documentation
explains how to deploy a Tempo instance using Tanka. You
will need to tweak the settings from the default Tanka configuration to:
- Expose the Zipkin collector
- Expose the GRPC Jaeger Query port
When the Tempo instance is deployed with the needed configurations, you have to
set
meshConfig.defaultConfig.tracing.zipkin.address
from Istio to the Tempo Distributor service and the Zipkin port. Tanka will deploy
the service in distributor.tempo.svc.cluster.local:9411.
The external_services.tracing.internal_url Kiali option needs to be set to:
http://query-frontend.tempo.svc.cluster.local:16685.
Tempo Operator
The Tempo Operator for Kubernetes
provides a native Kubernetes solution to deploy Tempo easily in your system.
After installing the Tempo Operator in your cluster, you can create a new
Tempo instance with the following CR:
kubectl create namespace tempo
kubectl apply -n tempo -f - <<EOF
apiVersion: tempo.grafana.com/v1alpha1
kind: TempoStack
metadata:
  name: smm
spec:
  storageSize: 1Gi
  storage:
    secret:
      type: s3
      name: object-storage
  template:
    queryFrontend:
      component:
        resources:
          limits:
            cpu: "2"
            memory: 2Gi
      jaegerQuery:
        enabled: true
        ingress:
          type: ingress
EOF
Note the name of the bucket where the traces will be stored in our example is
called object-storage. Check the
Tempo Operator
documentation to know more about what storages are supported and how to create
the secret properly to provide it to your Tempo instance.
Now, you are ready to configure the
meshConfig.defaultConfig.tracing.zipkin.address
field in your Istio installation. It needs to be set to the 9411 port of the
Tempo Distributor service. For the previous example, this value will be
tempo-smm-distributor.tempo.svc.cluster.local:9411.
Now, you need to configure the internal_url setting from Kiali to access
the Jaeger API. You can point to the 16685 port to use GRPC or 16686 if not.
For the given example, the value would be
http://tempo-ssm-query-frontend.tempo.svc.cluster.local:16685.
There is a related tutorial with detailed instructions to setup Kiali and Grafana Tempo with the Operator.
Configuration table
Supported versions
Kiali Version |
Jaeger |
Tempo |
Tempo with JaegerQuery |
| <= 1.79 (OSSM 2.5) |
✅ |
❌ |
✅ |
| > 1.79 |
✅ |
✅ |
✅ |
Minimal configuration for Kiali <= 1.79
In external_services.tracing
|
http
|
grpc
|
| Jaeger |
.internal_url = 'http://jaeger_service_url:16686/jaeger'
.use_grpc = false
|
.internal_url = 'http://jaeger_service_url:16685/jaeger'
.use_grpc = true (Not required: by default)
|
| Tempo |
.internal_url = 'http://query_frontend_url:16686'
.use_grpc = false
|
.internal_url = 'http://query_frontend_url:16685'
.use_grpc = true (Not required: by default)
|
Minimal configuration for Kiali > 1.79
|
http
|
grpc
|
| Jaeger |
.internal_url = 'http://jaeger_service_url:16686/jaeger'
.use_grpc = false
|
.internal_url = 'http://jaeger_service_url:16685/jaeger'
.use_grpc = true (Not required: by default)
|
| Tempo |
internal_url = 'http://query_frontend_url:3200'
.use_grpc = false
.provider = 'tempo'
|
.internal_url = 'http://query_frontend_url:3200'
.grpc_port: 9095
.provider: 'tempo'
.use_grpc = true (Not required: by default)
|
Tempo tuning
Resources consumption
Grafana Tempo is a powerful tool, but it can lead to performance issues when not configured correctly.
For example, the following configuration is not recommended and may lead to OOM issues for simple queries in the query-frontend component:
spec:
  resources:
    total:
      limits:
        memory: 2Gi
        cpu: 2000m
These resources are shared between all the Tempo components.
When needed, apply resources to each specific component, instead of applying the resources globally:
spec:
  template:
    queryFrontend:
      component:
        resources:
          limits:
            cpu: "2"
            memory: 2Gi
This Grafana Dashboard is available to measure the resources used in the tempo namespace.
Caching
Tempo offers multi-level caching that is used by default with Tanka and Helm deployment examples. It uses external cache, supporting Memcached and Redis.
The lower level cache has a higher hit rate, and caches bloom filters and parquet data.
The higher level caches frontend-search data.
Optimizing the cache depends on the application usage, and can be done modifying different parameters:
- Connection limit for MemCached: Should be increased in large deployments, as MemCached is set to 1024 by default.
- Cache size control: Should be increased when the working set is larger than the size of cache.
Tune search pipeline
There are many parameters to tune the search pipeline, some of these:
- max_concurrent_queries: If it is too high it can cause OOM.
- concurrent_jobs: How many jobs are done concurrently.
- max_retries: When it is too high it can result in a lot of load.
Dedicated attribute columns
When using the vParquet3 storage format , defining dedicated attribute columns can improve the query performance.
In order to best choose those columns (Up to 10), a good criteria is to choose attributes that contribute growing the block size (And not those commonly used).
Tempo authentication configuration
The Kiali CR provides authentication configuration that will be used also for querying the version check to provide information in the Mesh graph.
spec:
  external_services:
    tracing:
      enabled: true
      auth:
        insecure_skip_verify: false
        password: "pwd"
        token: ""
        type: "basic"
        use_kiali_token: false
        username: "user"
      health_check_url: ""
To configure a secret to be used as a password, see this FAQ entry.
TLS Certificate Configuration
If your Tempo server uses HTTPS with a certificate issued by a private CA, see the TLS Configuration page to learn how to configure Kiali to trust your CA.
Tempo cache
Kiali 2.2 includes a simple tracing cache for Tempo that stores the last N traces. By default, it is enabled and it keeps the last 200 traces. It can be modified in the Kiali CR with:
spec:
  external_services:
    tracing:
      enabled: true
      tempo_config:
        cache_enabled: true
        cache_capacity: 200
Kiali emits some cache metrics. The following query obtains the cache hit rate:
(sum(kiali_cache_hits_total{name="tempo"})/sum(kiali_cache_requests_total{name="tempo"})) * 100

13 - TLS Policy
How Kiali enforces TLS versions and cipher suites for its own server and all outbound clients.
Kiali uses one TLS policy for both its inbound server endpoint and every outbound client it creates—HTTP, gRPC, tracing exporters, and OpenID/OAuth HTTP flows. The policy is configured in deployment.tls_config in the Kiali CR. You decide whether the policy comes from the cluster (OpenShift TLSSecurityProfile) or from explicit settings.
Configuration Options
| Setting |
Description |
source |
auto (OpenShift only: reads cluster TLSSecurityProfile) or config (use explicit settings) |
min_version |
Minimum TLS version: TLSv1.2 or TLSv1.3 |
max_version |
Maximum TLS version: TLSv1.2 or TLSv1.3 |
cipher_suites |
List of OpenSSL cipher names for TLS 1.2 (ignored for TLS 1.3) |
| |
|
- OpenShift:
source defaults to auto (uses cluster’s TLSSecurityProfile)
- Non-OpenShift:
source defaults to config (requires explicit configuration)
Examples
OpenShift: Auto-Discover TLS Policy
On OpenShift, set source: auto to have Kiali automatically read and enforce the cluster’s TLSSecurityProfile from APIServer/cluster:
spec:
  deployment:
    tls_config:
      source: auto
With this configuration, Kiali reads the TLS settings from OpenShift’s API Server and enforces them for all connections. If the cluster profile changes, restart the Kiali pod to pick up the new settings.
Non-OpenShift: Explicit TLS 1.2 and 1.3
For non-OpenShift clusters, or when you want full control over TLS settings, use source: config with explicit values:
spec:
  deployment:
    tls_config:
      source: config
      min_version: TLSv1.2
      max_version: TLSv1.3
      cipher_suites:
      - ECDHE-RSA-AES128-GCM-SHA256
      - ECDHE-ECDSA-AES128-GCM-SHA256
      - ECDHE-RSA-AES256-GCM-SHA384
      - ECDHE-ECDSA-AES256-GCM-SHA384
This allows both TLS 1.2 and TLS 1.3 connections. The cipher suites apply only to TLS 1.2 connections; TLS 1.3 uses Go’s fixed cipher set.
TLS 1.3 Only
To enforce TLS 1.3 exclusively (highest security):
spec:
  deployment:
    tls_config:
      source: config
      min_version: TLSv1.3
When min_version is TLS 1.3, Kiali enforces TLS 1.3-only mode. The cipher_suites setting is ignored because TLS 1.3 cipher selection is managed by Go.
Secure Defaults (Minimal Configuration)
If you set source: config without specifying other values, Kiali applies secure defaults:
spec:
  deployment:
    tls_config:
      source: config
This enforces TLS 1.2 or higher with Kiali’s secure default cipher list for TLS 1.2 connections:
ECDHE-ECDSA-AES128-GCM-SHA256ECDHE-RSA-AES128-GCM-SHA256ECDHE-ECDSA-AES256-GCM-SHA384ECDHE-RSA-AES256-GCM-SHA384ECDHE-ECDSA-CHACHA20-POLY1305ECDHE-RSA-CHACHA20-POLY1305
These ciphers use ECDHE for forward secrecy and support both ECDSA and RSA certificates with modern AEAD encryption (AES-GCM and ChaCha20-Poly1305).
Supported Values
TLS Versions
TLS 1.0 and 1.1 are not supported due to known security vulnerabilities. Attempting to use them will cause Kiali to fail at startup.
Supported version strings (case variations accepted):
TLSv1.2 / TLS1.2 / VersionTLS12TLSv1.3 / TLS1.3 / VersionTLS13
TLS 1.2 Cipher Suites
Specify cipher suites using OpenSSL names:
| Cipher Suite |
ECDHE-RSA-AES128-GCM-SHA256 |
ECDHE-ECDSA-AES128-GCM-SHA256 |
ECDHE-RSA-AES256-GCM-SHA384 |
ECDHE-ECDSA-AES256-GCM-SHA384 |
ECDHE-RSA-CHACHA20-POLY1305 |
ECDHE-ECDSA-CHACHA20-POLY1305 |
AES128-GCM-SHA256 |
AES256-GCM-SHA384 |
| |
Unsupported cipher names will cause validation failure at startup.
Behavior
Fail-Fast Safety
Kiali refuses to start if:
- The
source value is invalid
source=auto is used on a non-OpenShift cluster- The OpenShift TLSSecurityProfile cannot be read
- An unsupported TLS version or cipher suite is specified
Enforcement Scope
The resolved TLS policy applies to:
- Kiali server’s inbound TLS configuration
- All outbound HTTP clients (Prometheus, Grafana, tracing exporters, auth flows)
- All outbound gRPC clients
Skip-Verify Behavior
Setting skip_verify: true on external services only bypasses certificate validation. TLS versions and cipher suites are still enforced according to the policy.
Policy Refresh
The TLS policy is resolved once at startup and cached for the lifetime of the Kiali process. When using source=auto, if the OpenShift TLSSecurityProfile changes, you must restart the Kiali pod for changes to take effect.
Logging
On startup, Kiali logs which TLS policy source is active and the resolved min/max versions and cipher count. Check these logs to verify the policy in effect or troubleshoot startup failures.
14 - Traffic Health
Customizing Health for Request Traffic.
There are times when Kiali’s default thresholds for traffic health do not work well for a particular situation. For example, at times 404 response codes are expected. Kiali has the ability to set powerful, fine-grained overrides for health configuration.
Default Configuration
By default Kiali uses the traffic rate configuration shown below. Application errors have minimal tolerance while client errors have a higher tolerance reflecting that some level of client errors is often normal (e.g. 404 Not Found):
- For http protocol 4xx are client errors and 5xx codes are application errors.
- For grpc protocol all 1-16 are errors (0 is success).
So, for example, if the rate of application errors is >= 0.1% Kiali will show Degraded health and if > 10% will show Failure health.
# ...
  health_config:
    rate:
      - namespace: ".*"
        kind: ".*"
        name: ".*"
        tolerance:
          - code: "^5\\d\\d$"
            direction: ".*"
            protocol: "http"
            degraded: 0
            failure: 10
          - code: "^4\\d\\d$"
            direction: ".*"
            protocol: "http"
            degraded: 10
            failure: 20
          - code: "^[1-9]$|^1[0-6]$"
            direction: ".*"
            protocol: "grpc"
            degraded: 0
            failure: 10
# ...
Custom Configuration
Custom health configuration is specified in the Kiali CR. To see the supported configuration syntax for health_config see the Kiali CR Reference.
Kiali applies the first matching rate configuration (namespace, kind, etc) and calculates the status for each tolerance. The reported health will be the status with highest priority (see below).
| Rate Option | Definition | Default |
| namespace | Matching Namespaces (regex) | .* (match all) |
| kind | Matching Resource Types (workload|app|service) (regex) | .* (match all) |
| name | Matching Resource Names (regex) | .* (match all) |
| tolerance | Array of tolerances to apply. |
| Tolerance Option |
Definition |
Default |
| code |
Matching Response Status Codes (regex) [1] |
required |
| direction |
Matching Request Directions (inbound|outbound) (regex) |
.* (match all) |
| protocol |
Matching Request Protocols (http|grpc) (regex) |
.* (match all) |
| degraded |
Degraded Threshold(% matching requests >= value) |
0 |
| failure |
Failure Threshold (% matching requests >= value) |
0 |
[1] The status code typically depends on the request protocol. The special code -, a single dash, is used for requests that don’t receive a response, and therefore no response code.
Kiali reports traffic health with the following top-down status priority :
| Priority |
Rule (value=% matching requests) |
Status |
| 1 |
value >= FAILURE threshold |
 FAILURE FAILURE |
| 2 |
value >= DEGRADED threshold AND value < FAILURE threshold |
 DEGRADED DEGRADED |
| 3 |
value > 0 AND value < DEGRADED threshold |
 HEALTHY HEALTHY |
| 4 |
value = 0 |
 HEALTHY HEALTHY |
| 5 |
No traffic |
 No Health Information No Health Information |
Examples
These examples use the repo https://github.com/kiali/demos/tree/master/error-rates.
In this repo we can see 2 namespaces: alpha and beta (Demo design).
| Alpha |

|
Where nodes return the responses (You can configure responses here):
| App (alpha/beta) |
Code |
Rate |
| x-server |
200 |
9 |
| x-server |
404 |
1 |
| y-server |
200 |
9 |
| y-server |
500 |
1 |
| z-server |
200 |
8 |
| z-server |
201 |
1 |
| z-server |
201 |
1 |
The applied traffic rate configuration is:
# ...
health_config:
  rate:
   - namespace: "alpha"
     tolerance:
       - code: "404"
         failure: 10
         protocol: "http"
       - code: "[45]\\d[^\\D4]"
         protocol: "http"
   - namespace: "beta"
     tolerance:
       - code: "[4]\\d\\d"
         degraded: 30
         failure: 40
         protocol: "http"
       - code: "[5]\\d\\d"
         protocol: "http"
# ...
After Kiali adds default configuration we have the following (Debug Info Kiali):
{
  "healthConfig": {
    "rate": [
      {
        "namespace": "/alpha/",
        "kind": "/.*/",
        "name": "/.*/",
        "tolerance": [
          {
            "code": "/404/",
            "degraded": 0,
            "failure": 10,
            "protocol": "/http/",
            "direction": "/.*/"
          },
          {
            "code": "/[45]\\d[^\\D4]/",
            "degraded": 0,
            "failure": 0,
            "protocol": "/http/",
            "direction": "/.*/"
          }
        ]
      },
      {
        "namespace": "/beta/",
        "kind": "/.*/",
        "name": "/.*/",
        "tolerance": [
          {
            "code": "/[4]\\d\\d/",
            "degraded": 30,
            "failure": 40,
            "protocol": "/http/",
            "direction": "/.*/"
          },
          {
            "code": "/[5]\\d\\d/",
            "degraded": 0,
            "failure": 0,
            "protocol": "/http/",
            "direction": "/.*/"
          }
        ]
      },
      {
        "namespace": "/.*/",
        "kind": "/.*/",
        "name": "/.*/",
        "tolerance": [
          {
            "code": "/^5\\d\\d$/",
            "degraded": 0,
            "failure": 10,
            "protocol": "/http/",
            "direction": "/.*/"
          },
          {
            "code": "/^4\\d\\d$/",
            "degraded": 10,
            "failure": 20,
            "protocol": "/http/",
            "direction": "/.*/"
          },
          {
            "code": "/^[1-9]$|^1[0-6]$/",
            "degraded": 0,
            "failure": 10,
            "protocol": "/grpc/",
            "direction": "/.*/"
          }
        ]
      }
    ]
  }
}
What are we applying?
-
For namespace alpha, all resources
-
Protocol http if % requests with error code 404 are >= 10 then FAILURE, if they are > 0 then DEGRADED
-
Protocol http if % requests with others error codes are> 0 then FAILURE.
-
For namespace beta, all resources
-
Protocol http if % requests with error code 4xx are >= 40 then FAILURE, if they are >= 30 then DEGRADED
-
Protocol http if % requests with error code 5xx are > 0 then FAILURE
-
For other namespaces Kiali will apply the defaults.
-
Protocol http if % requests with error code 5xx are >= 20 then FAILURE, if they are >= 0.1 then DEGRADED
-
Protocol grpc if % requests with error code match /^[1-9]$|^1[0-6]$/ are >= 20 then FAILURE, if they are >= 0.1 then DEGRADED
| Alpha |
Beta |
 |
 |
15 - Virtual Machine workloads
Ensuring Kiali can visualize a VM WorkloadEntry.
Introduction
Kiali graph visualizes both Virtual Machine workloads (WorkloadEntry) and pod-based workloads, running inside a Kubernetes cluster. You must ensure that the Istio Proxy is running, and correctly configured, on the Virtual Machine. Also, Prometheus must be able to scrape the metrics endpoint of the Istio Proxy running on the VM. Kiali will then be able to read the traffic telemetry for the Virtual Machine workloads, and incorporate the VM workloads into the graph.
Kiali does not currently distinguish between pod-based and VM-based workloads nor does Kiali support viewing additional details for the VM-based workloads beyond what is displayed on the graph. One way to distinguish between the two is to give the VM-based workloads a different version label than the pod-based workloads.
Configuring Prometheus to scrape VM-based Istio Proxy
Once the Istio Proxy is running on a Virtual Machine, configuring Prometheus to scrape the VM’s Istio Proxy metrics endpoint is the only configuration Kiali needs to display traffic for the VM-based workload.
Configuring Prometheus will vary between environments. Here is a very simple example of a Prometheus configuration that includes a job to scrape VM based workloads:
- job_name: bookinfo-vms
  honor_timestamps: true
  scrape_interval: 15s
  scrape_timeout: 10s
  metrics_path: /stats/prometheus
  scheme: http
  follow_redirects: true
  static_configs:
  - targets:
    - details-v1:15020
    - productpage-v1:15020
    - ratings-v1:15020
    - reviews-v1:15020
    - reviews-v2:15020
    - reviews-v3:15020


 FAILURE
 DEGRADED
 HEALTHY
 No Health Information