This is the multi-page printable view of this section. Click here to print.
OSSMC
1 - Navigating Multiple Meshes with OSSMC
OpenShift Service Mesh Console (OSSMC) includes Istios and Kialis pages in the OpenShift Console Service Mesh menu. These pages let you browse and inspect every Istio and Kiali CR on the cluster directly from the console — without requiring a Kiali server to be connected to the plugin.
This is especially useful when a cluster hosts many mesh instances. Platform teams that operate dozens or hundreds of Istio control planes (and the Kiali instances that observe them) on a cluster can navigate that inventory in one place instead of jumping between CLI commands, individual operator UIs, or separate Kiali routes.
Why this matters
- One inventory for the whole cluster — List every Istio CR and every Kiali CR from the OpenShift Console sidebar.
- No Kiali server required — The pages talk to the Kubernetes API. You can install the OSSMC plugin independently of any Kiali Server and still get this multi-mesh navigation.
- Works alongside Kiali-powered observability — When you do connect a Kiali server to the plugin, Overview, Traffic Graph, and the other observability pages appear for that connected instance. Istios and Kialis stay in the menu so you can still manage the full fleet.
Istio control planes
The Istios page lists every cluster-scoped Istio CR managed by the OSSM/Sail Operator. Open a row to see details for that Istio installation.
Use this page when you need a console view of mesh control-plane instances on the cluster — for example, confirming which Istio CRs exist, opening one for more information, or orienting yourself before connecting a related Kiali instance.
Kiali instances
The Kialis page lists every Kiali CR on the cluster. Open a row to see configuration from that Kiali CR.
istios.sailoperator.io or kialis.kiali.io, the list may show fewer instances than actually exist on the cluster — or appear empty. If you expect to see an instance that is missing, ask your cluster administrator to grant list/get permission on the relevant CR in that namespace (or cluster-wide).
The list includes:
- Connected — Shows Active when that Kiali instance is the OSSMC backend, or Inactive when it is not. If OSSMConsole resources cannot be read, the status shows Unknown.
- Observe — When route hosts are available, links to the Kiali UI and the OpenShift Console (Kiali | Console).
- Actions — Connect or Disconnect to change which Kiali server OSSMC uses.
From the list or detail page you can Connect or Disconnect a Kiali instance:
- Connect — Connects that Kiali server to the OSSMC plugin so Overview, Traffic Graph, Mesh, and the other Kiali-powered pages become available for that instance.
- Disconnect — Disconnects that Kiali instance from the plugin. Istios and Kialis remain available so you can keep navigating the fleet and connect a different instance when needed.
Connect and disconnect require permission to patch the OSSMConsole CR (ossmconsoles.kiali.io).
When a Kiali server is connected — and when it is not
What you see in the Service Mesh menu depends on whether OSSMC has a connected, reachable Kiali server:
- When no Kiali server is connected — Expect Istios and Kialis only.
- When a Kiali instance is connected and reachable — Expect observability pages (Overview, Traffic Graph, Mesh, and others) in the menu, with Istios and Kialis at the bottom, below a separator.
If OSSMC is configured to use a Kiali server but cannot reach it, observability pages show a Service Mesh is not configured message. Istios and Kialis continue to work — the same as when no server is connected.
Getting started
- Install the Kiali Operator (a Kiali server is optional for these pages).
- Create an OSSMConsole CR to install the plugin — see The OSSMConsole CR.
- Open Service Mesh → Istios or Kialis in the OpenShift Console.
To connect a Kiali server for deep observability on one instance, use Connect on the Kialis page or set spec.kiali on the OSSMConsole CR. See Connecting a Kiali instance to the console.
For a tour of the Kiali-powered pages (Overview, Traffic Graph, and the rest), see the OSSMC User Guide.
2 - OSSMC User Guide
The OpenShift Service Mesh Console (OSSMC) is an extension to the OpenShift Console which provides visibility into your Service Mesh. With the OSSMC plugin installed, a new Service Mesh menu category is available in the navigation menu on the left side of the web console.
Which pages appear depends on whether a Kiali server is connected to the plugin:
- With a connected Kiali server — When a Kiali instance is connected and reachable, OSSMC provides the full Kiali-powered experience: dedicated list and detail pages for mesh components, plus Service Mesh tabs on OpenShift Workloads, Services, Projects, and Istio configuration detail pages. The features match those of the standalone Kiali Console, organized to integrate with the OpenShift Console.
- Without a connected Kiali server — When no Kiali instance is connected (or Kiali is not reachable), OSSMC still provides Istios and Kialis pages that list every Istio and Kiali CR on the cluster. These pages do not require a Kiali server and are especially useful for navigating many mesh instances from one console. See Navigating Multiple Meshes.
The OSSMC plugin does not replace the standalone Kiali Console. After installing OSSMC, you can still access Kiali through its own route when a Kiali server is deployed. This User Guide discusses the extensions you see from within the OpenShift Console itself — primarily the Kiali-powered pages. For Istios and Kialis, see Navigating Multiple Meshes.
Service Mesh Navigation
The OSSMC plugin adds a Service Mesh category to the OpenShift Console sidebar. The pages available depend on whether a Kiali server is connected to the plugin.
Pages that require a connected Kiali server
When a Kiali instance is connected and reachable, the following pages appear in the Service Mesh menu. Each is documented in its own section later in this guide.
- Overview — Namespace summary with health and metric cards
- Traffic Graph — Full mesh topology view
- Mesh — Istio infrastructure status
- Namespaces — Namespace list with health, labels, and detail links
- Applications — Application list with a dedicated detail page
- Services — Service list with detail pages
- Workloads — Workload list with health, type, and Istio configuration
- Istio Config — Istio configuration list with validation status
All of these pages are standalone routes within the OSSMC plugin, providing a consistent Kiali-powered experience without leaving the OpenShift Console context.
OSSMC connects to the connected Kiali instance through the plugin proxy configured on the OSSMConsole CR. Service Mesh tabs on workload, service, project, and Istio resource detail pages are also available when a Kiali server is connected.
If OSSMC is configured to use a Kiali server but cannot connect to it, pages that require Kiali show a Service Mesh is not configured message with guidance to install and configure Kiali through the Kiali Operator. Istios and Kialis remain available — see Navigating Multiple Meshes.
If a page that requires Kiali fails unexpectedly, OSSMC displays a Service Mesh Console Unavailable message instead of affecting the rest of the OpenShift Console. If you use the Fleet Service Mesh perspective and are not using those Kiali-backed pages on that cluster, you can ignore this message.
Navigating Multiple Meshes with OSSMC
Istios and Kialis are always available in the Service Mesh menu. When a Kiali server is also connected, they appear at the bottom of the menu below a separator. Use them to browse every Istio and Kiali instance on the cluster and to connect or disconnect which Kiali server the plugin uses for observability.
See Navigating Multiple Meshes for details.
Overview
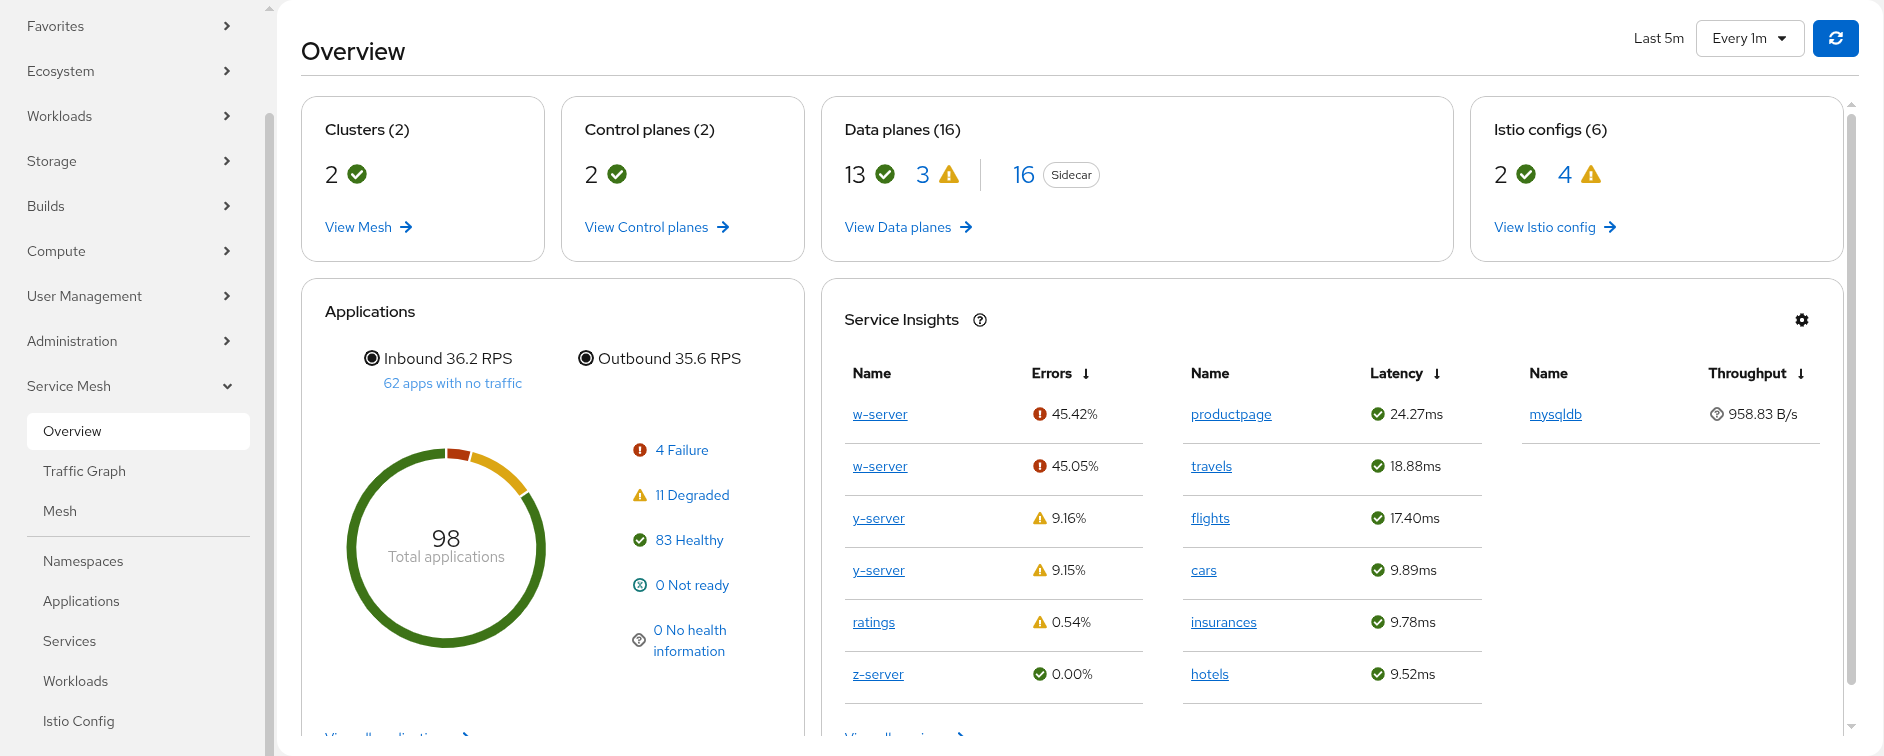
The Overview page provides a summary of your mesh by showing cards representing the namespaces participating in the mesh. Each namespace card has summary metric graphs and additional health details. There are links in the cards that take you to other pages within OSSMC.
Traffic Graph
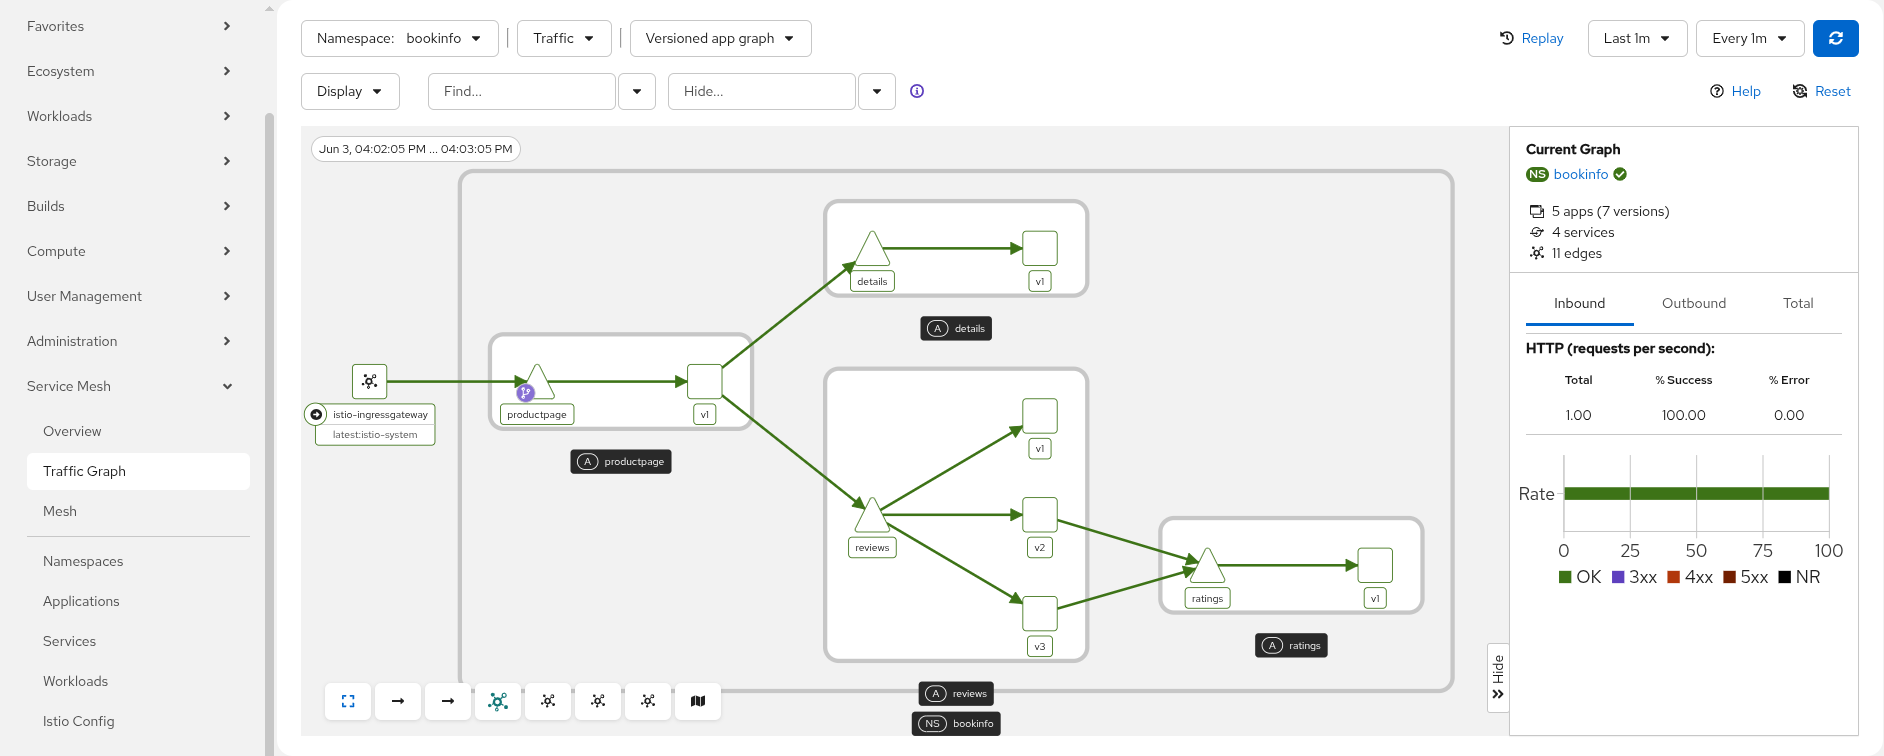
The Traffic Graph page provides the full topology view of your mesh. The mesh is represented by nodes and edges — each node representing a component of the mesh and each edge representing traffic flowing through the mesh between components.
Mesh
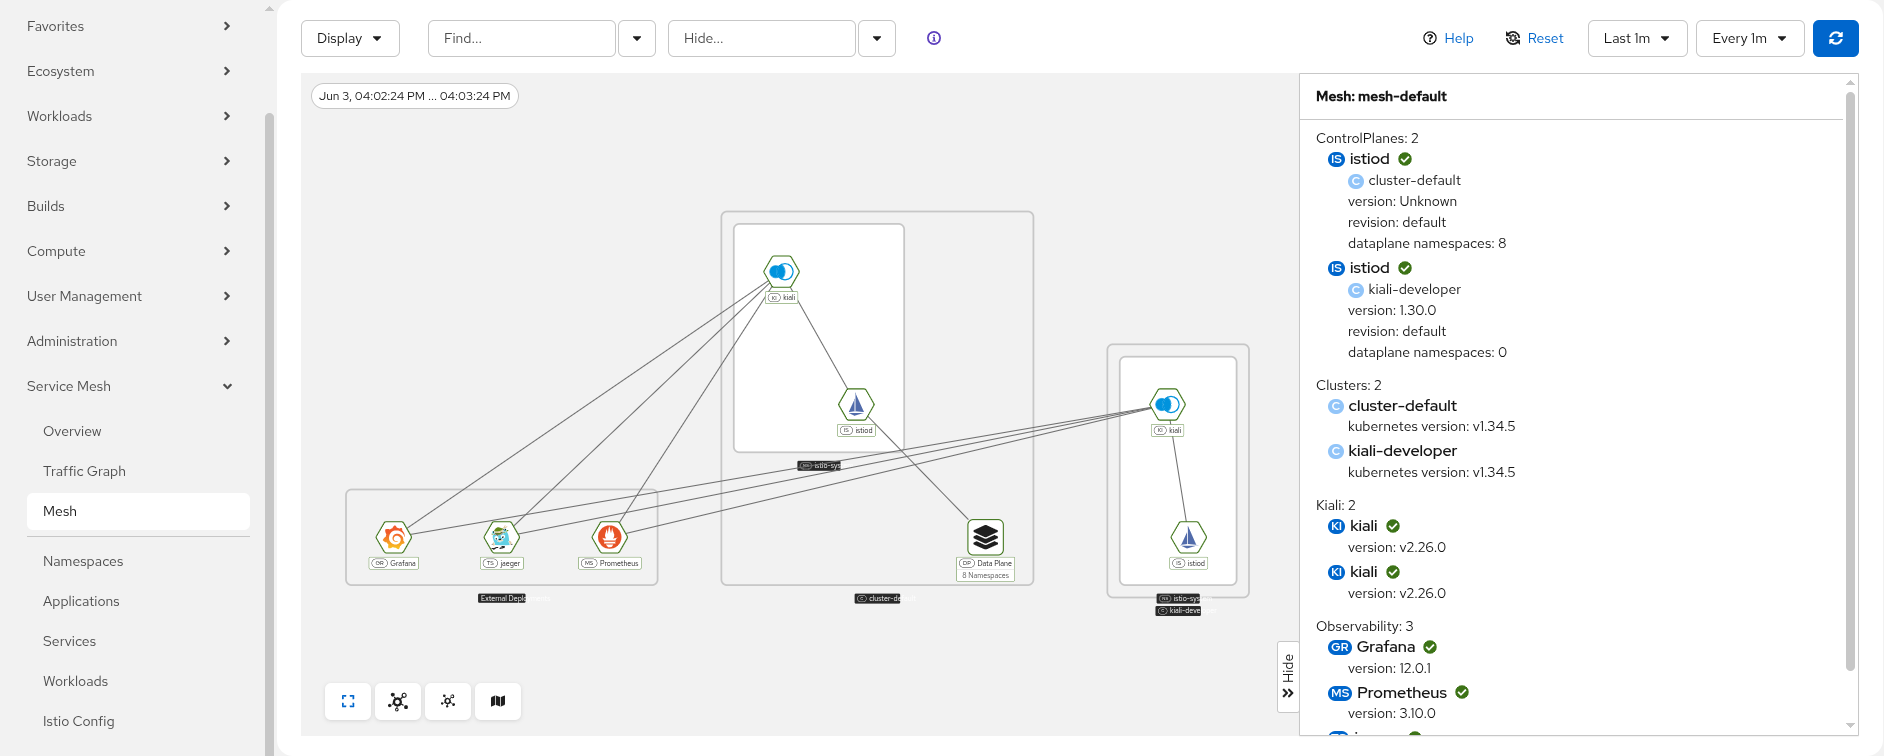
The Mesh page provides detailed information about the Istio infrastructure status. It shows an infrastructure topology view with core and add-on components, their health, and how they are connected to each other.
Namespaces
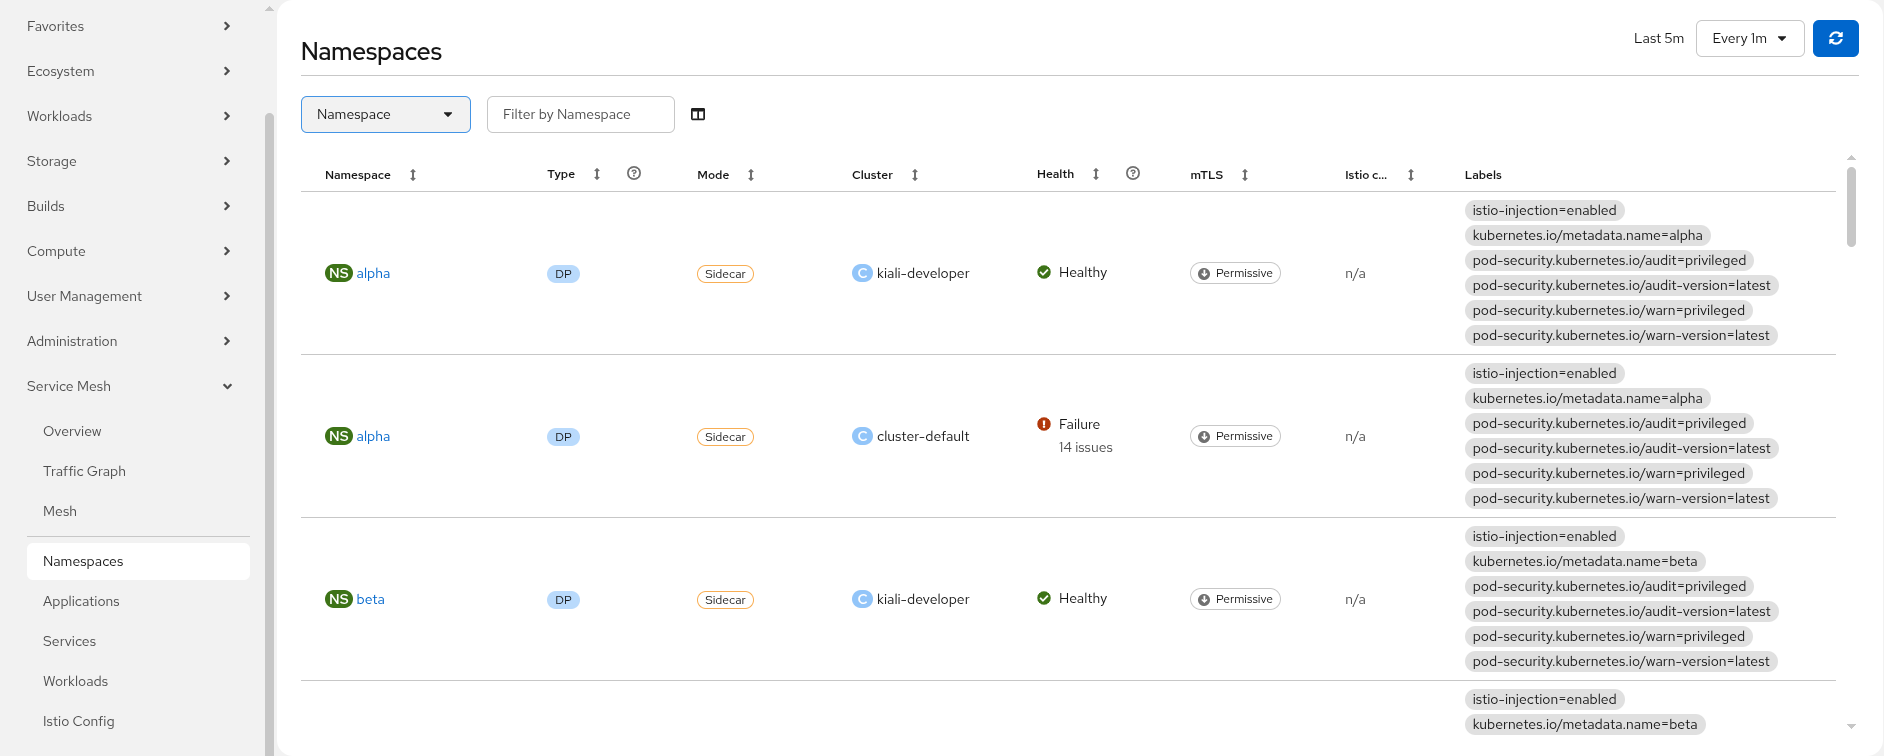
The Namespaces page provides a list of namespaces participating in the mesh along with their health status and labels. Clicking a namespace opens a detail page with a split-panel layout: the left panel contains stacked cards showing namespace attributes, resource links, and health information, while the right panel displays a namespace-scoped traffic minigraph.
Applications
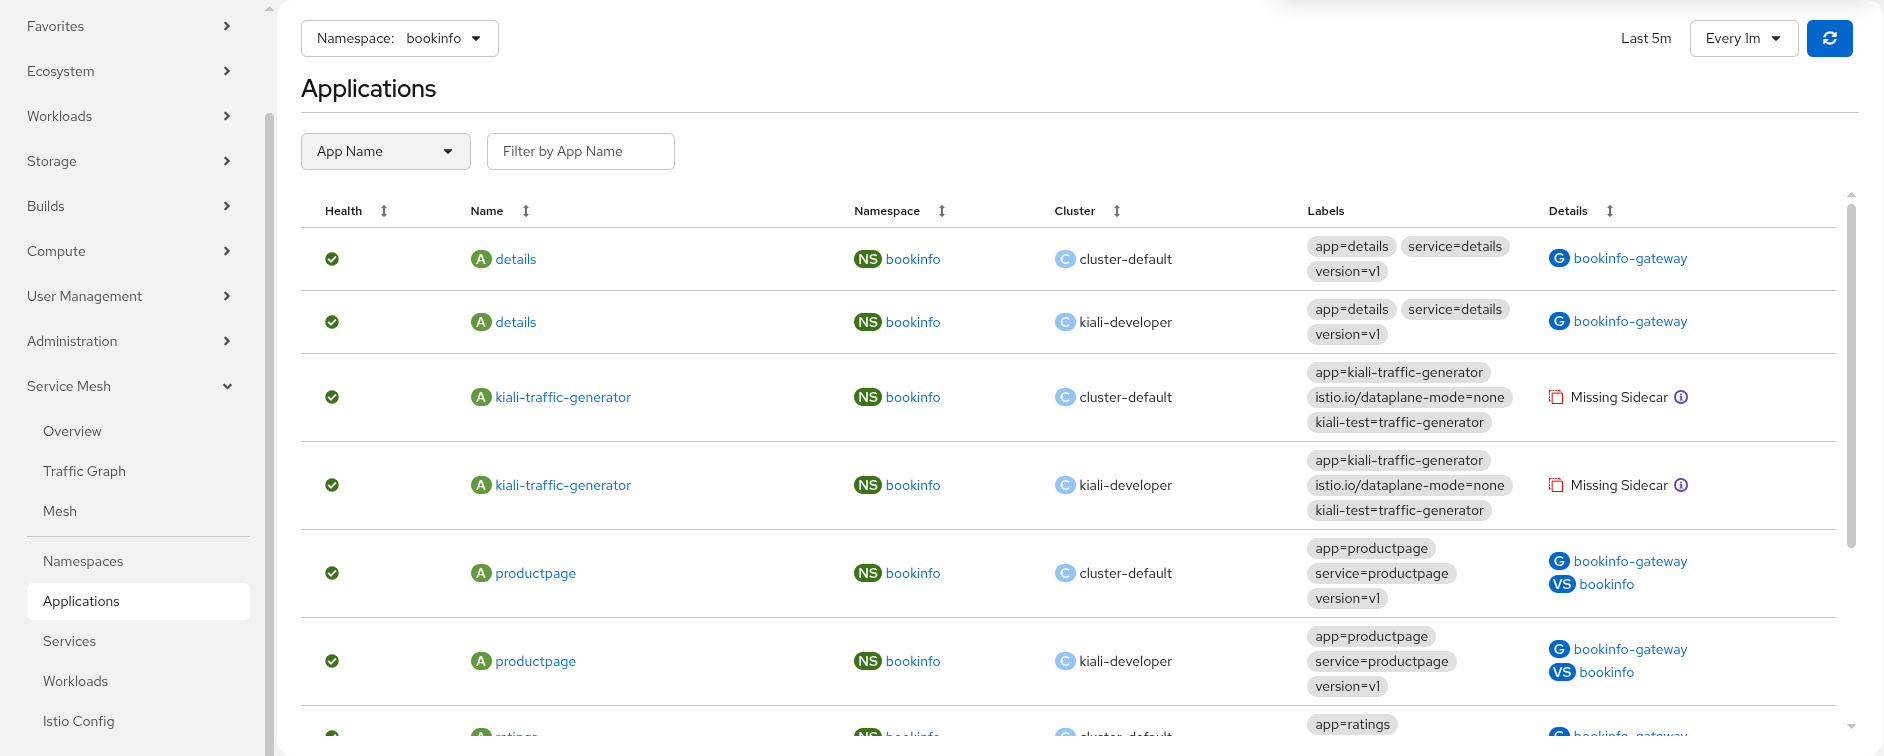
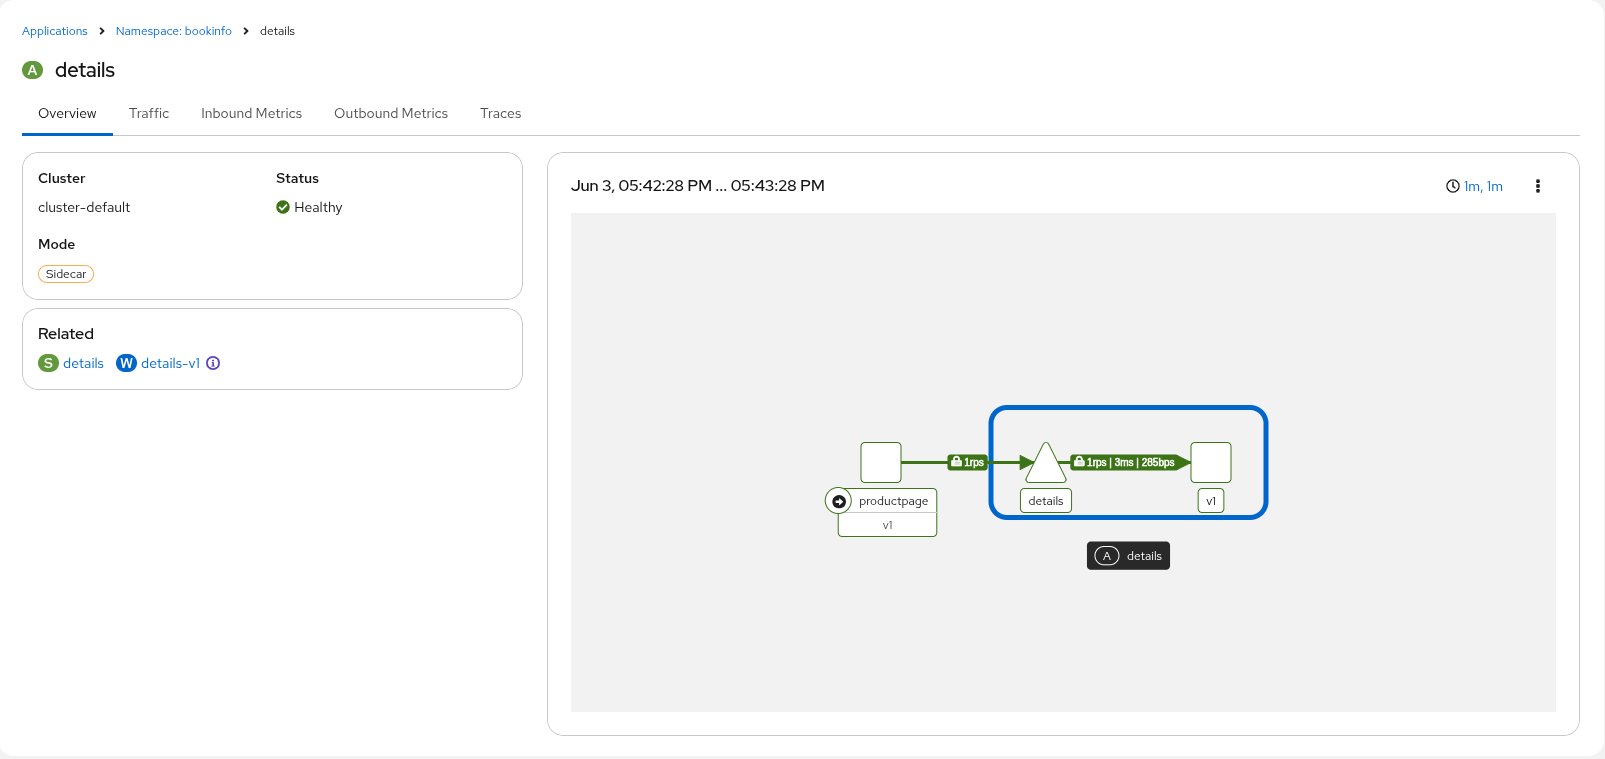
The Applications page provides a list of applications detected in the mesh. Clicking an application opens a dedicated detail page with sub-tabs for Overview, Traffic, Inbound Metrics, and Traces. The application detail page displays an application badge and provides the same level of detail as the standalone Kiali Console.
Services
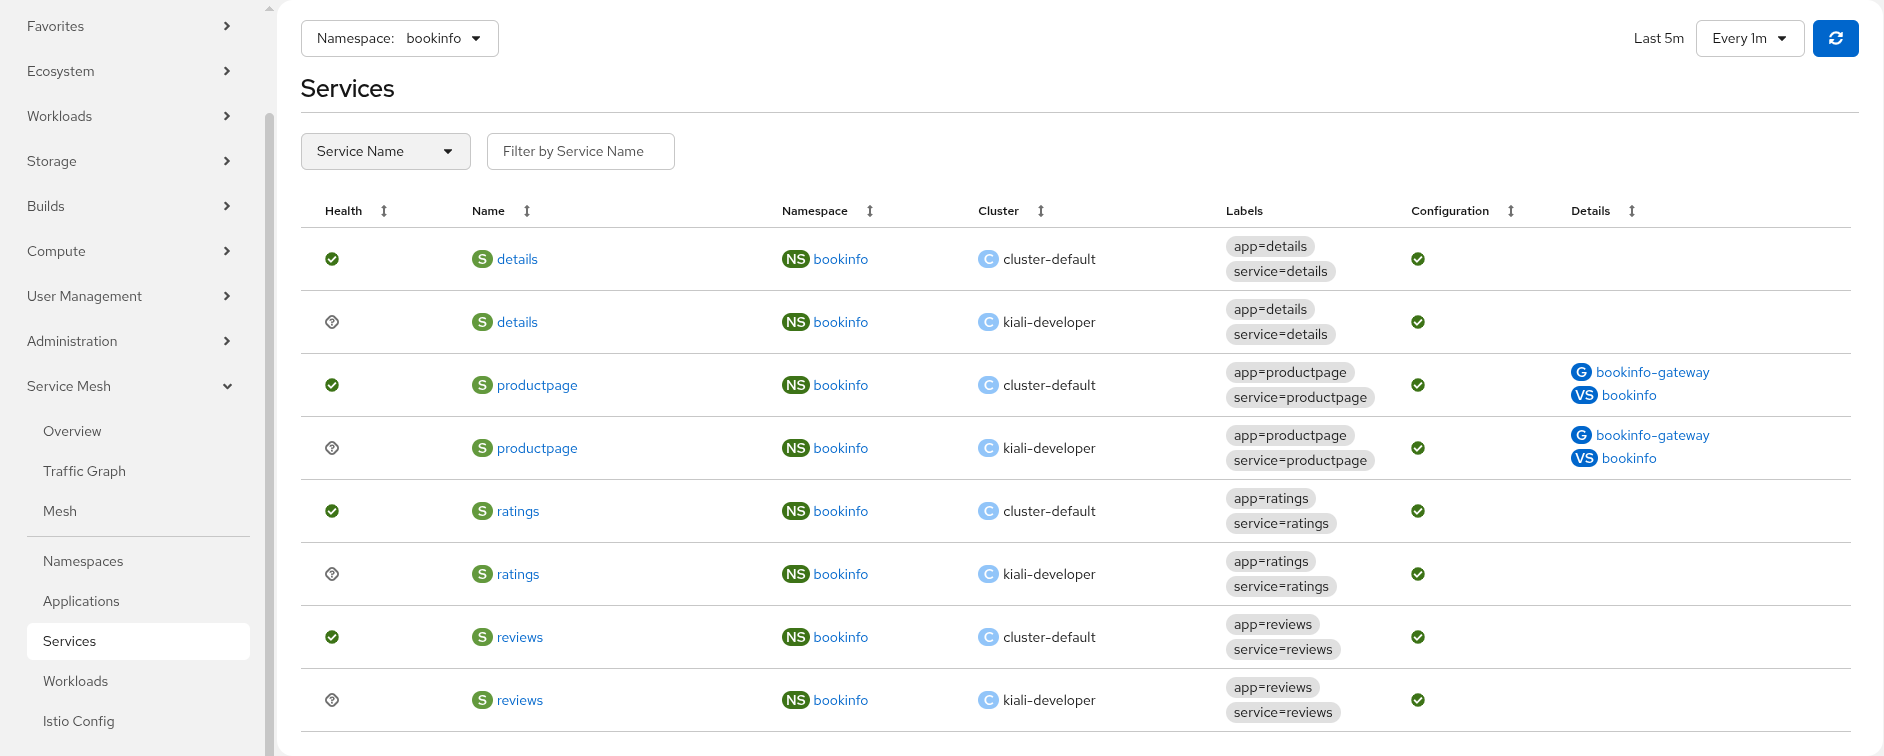
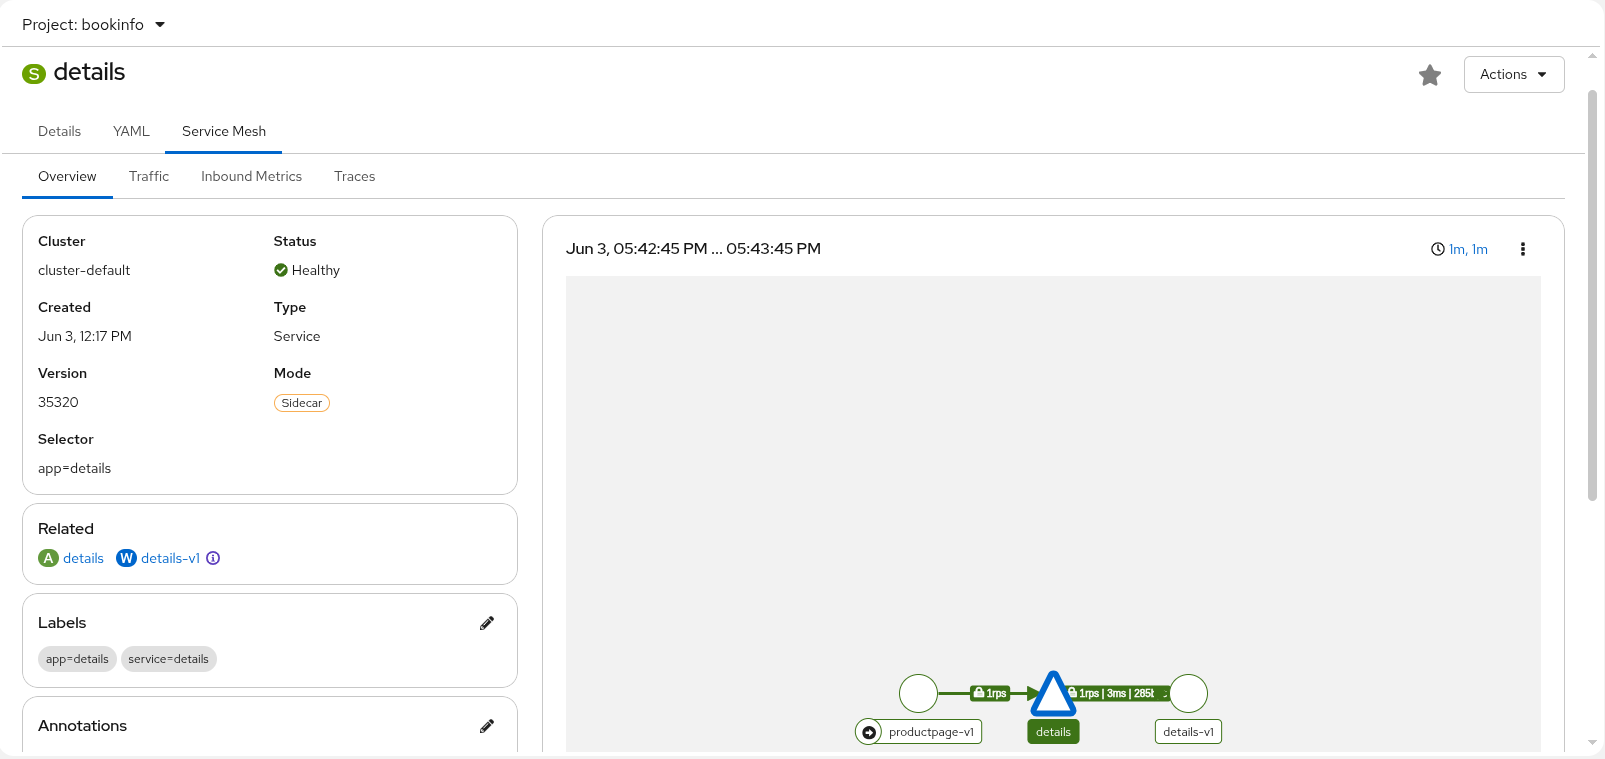
The Services page provides a list of services in the mesh. Clicking a service opens a detail page with sub-tabs for Overview, Traffic, Inbound Metrics, and Traces.
Workloads
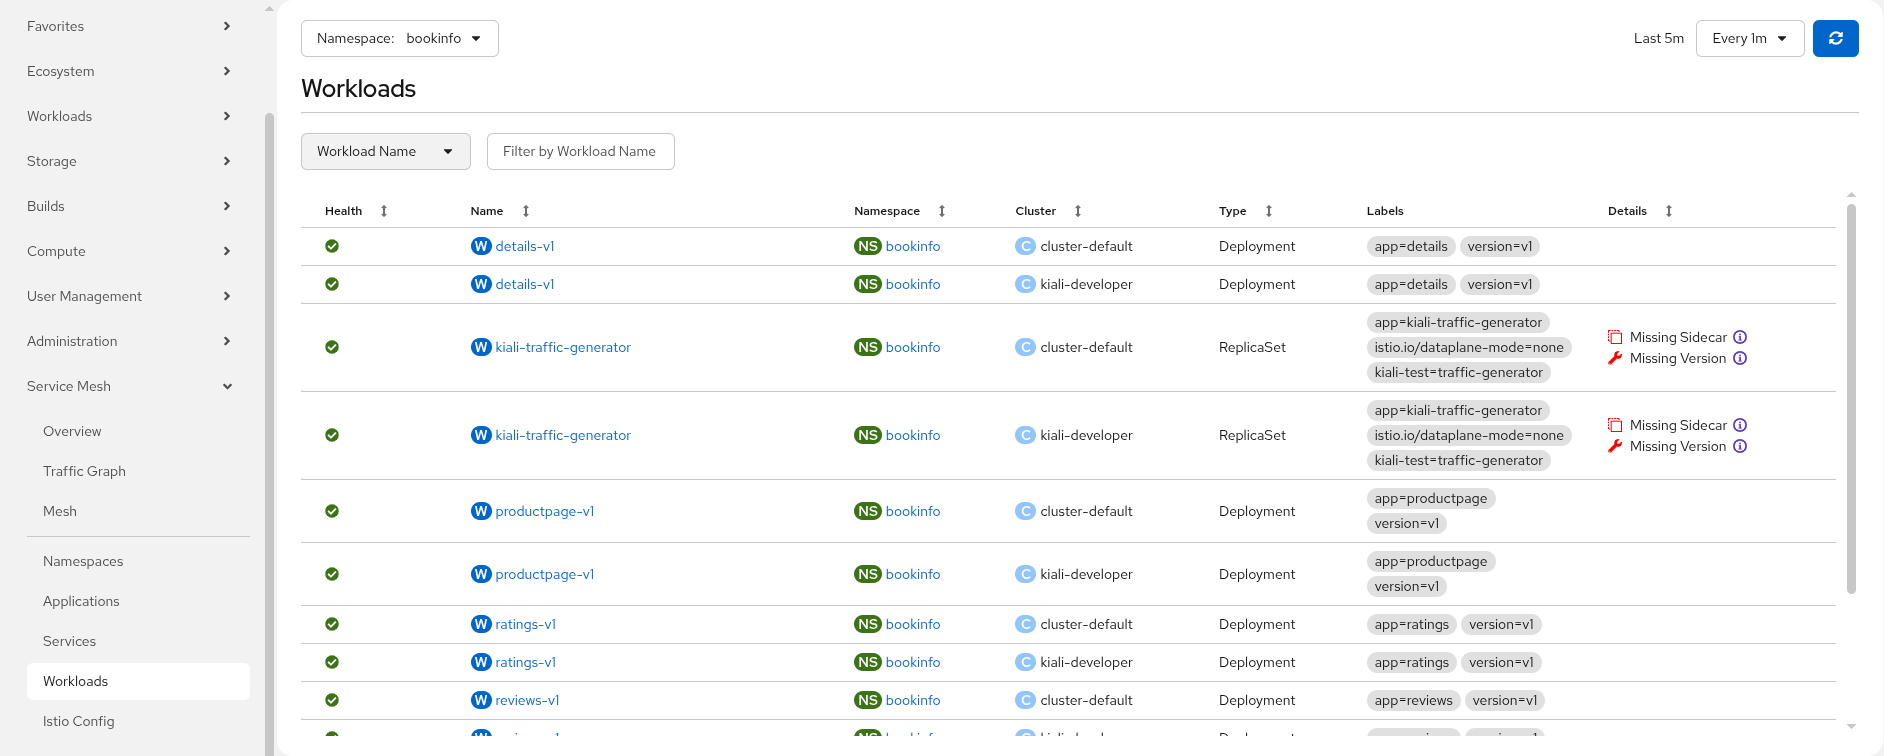
The Workloads page provides a list of workloads in the mesh along with their health status, type, and associated Istio configuration. Clicking a workload navigates to the corresponding Kubernetes resource detail page (Deployment, ReplicaSet, DaemonSet, StatefulSet, etc.) with the Service Mesh tab selected.
Istio Config
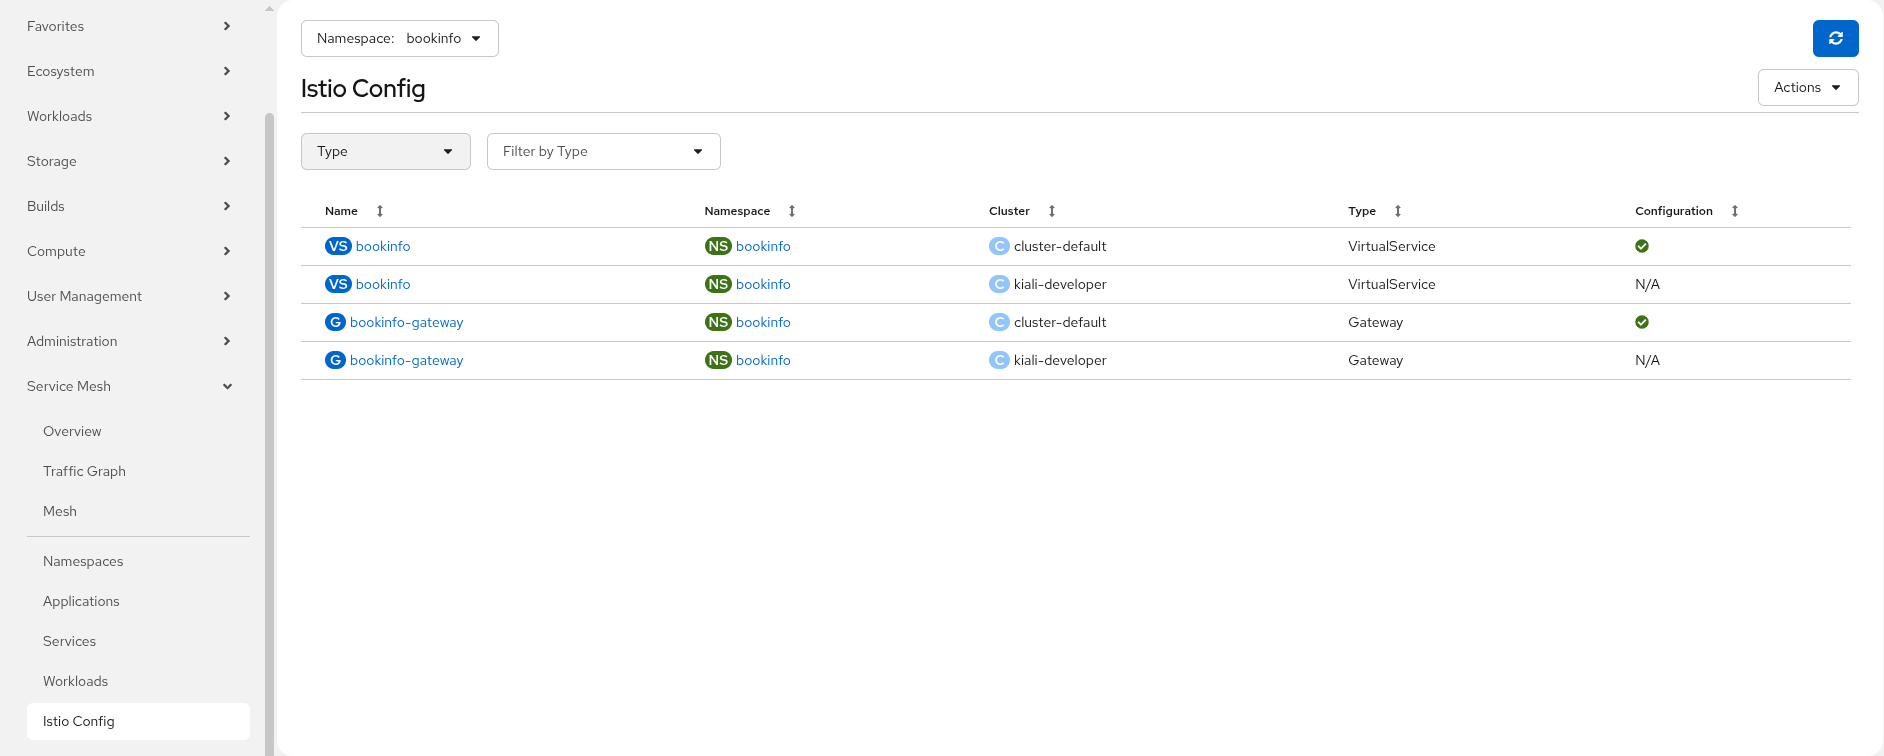
The Istio Config page provides a list of all Istio configuration files in your mesh with a column that provides a quick way to know if the configuration for each resource is valid. You can also create new Istio configuration resources from this page. The list page uses Kiali’s full filtering capabilities, including type, name, and validation status filters.
Workload Details
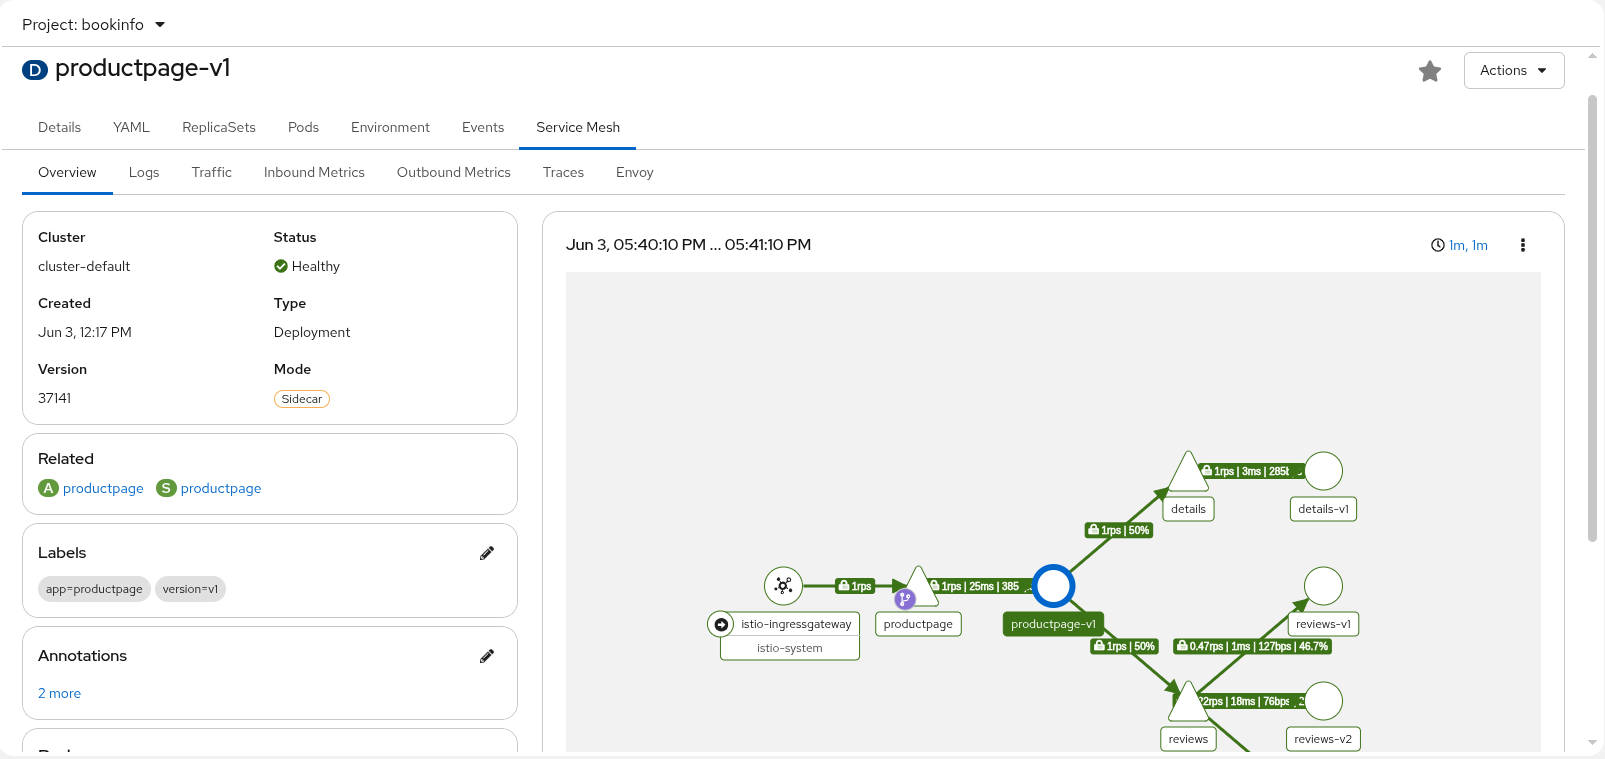
The Workloads detail view (accessible from the OpenShift Workloads pages such as Deployments, Pods, ReplicaSets, StatefulSets, and DaemonSets) has a tab Service Mesh that provides mesh-related detail for the selected workload. The details are grouped into several sub-tabs: Overview, Traffic, Logs, Inbound Metrics, Outbound Metrics, Traces, and Envoy.
Workload: Overview
The Workload: Overview sub-tab provides a summary of the selected workload including a localized topology graph showing the workload with all inbound and outbound edges and nodes.
Workload: Traffic
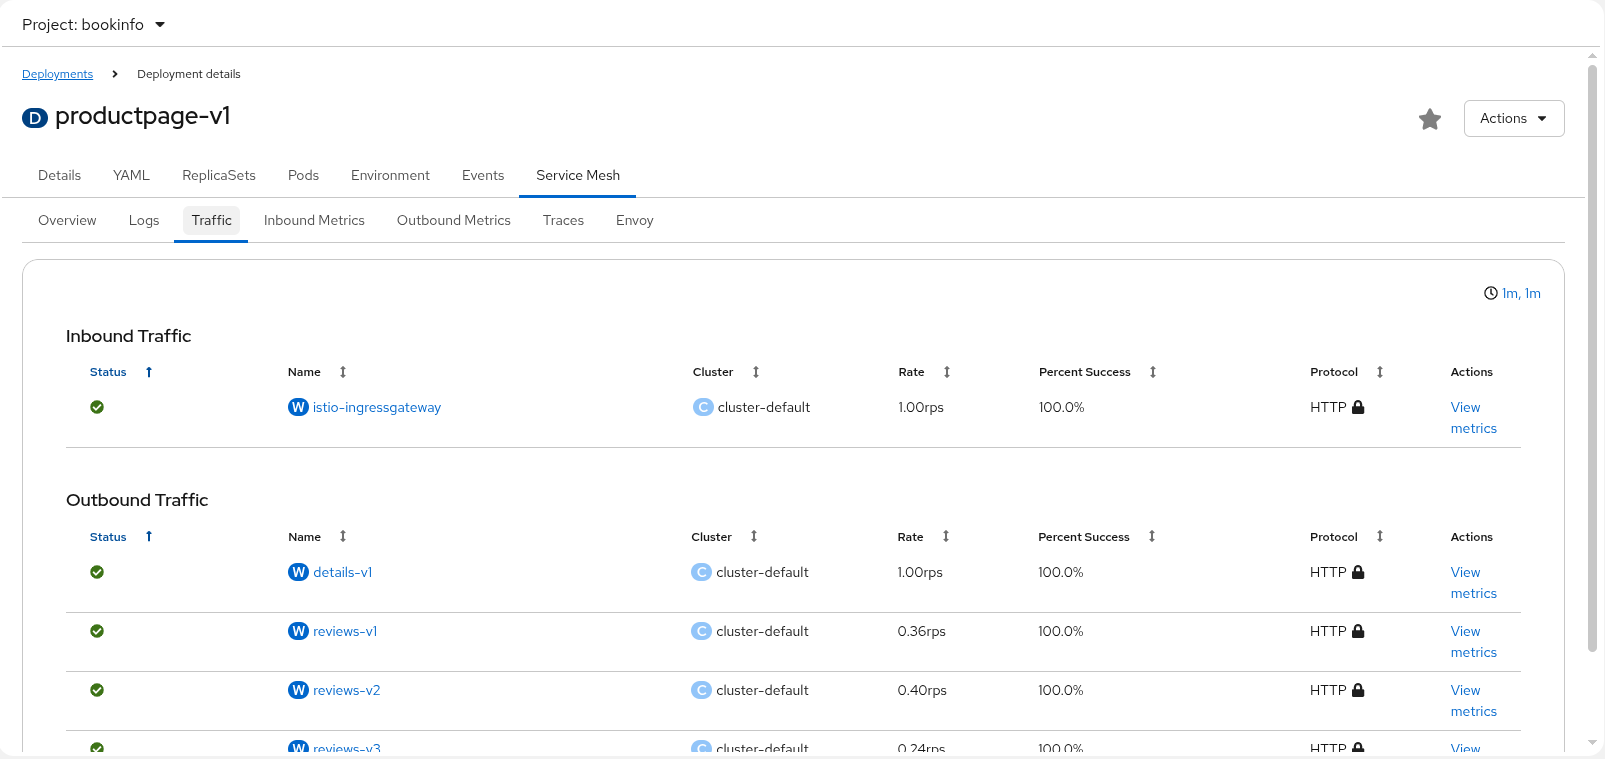
The Workload: Traffic sub-tab provides information about all inbound and outbound traffic to the workload.
Workload: Logs
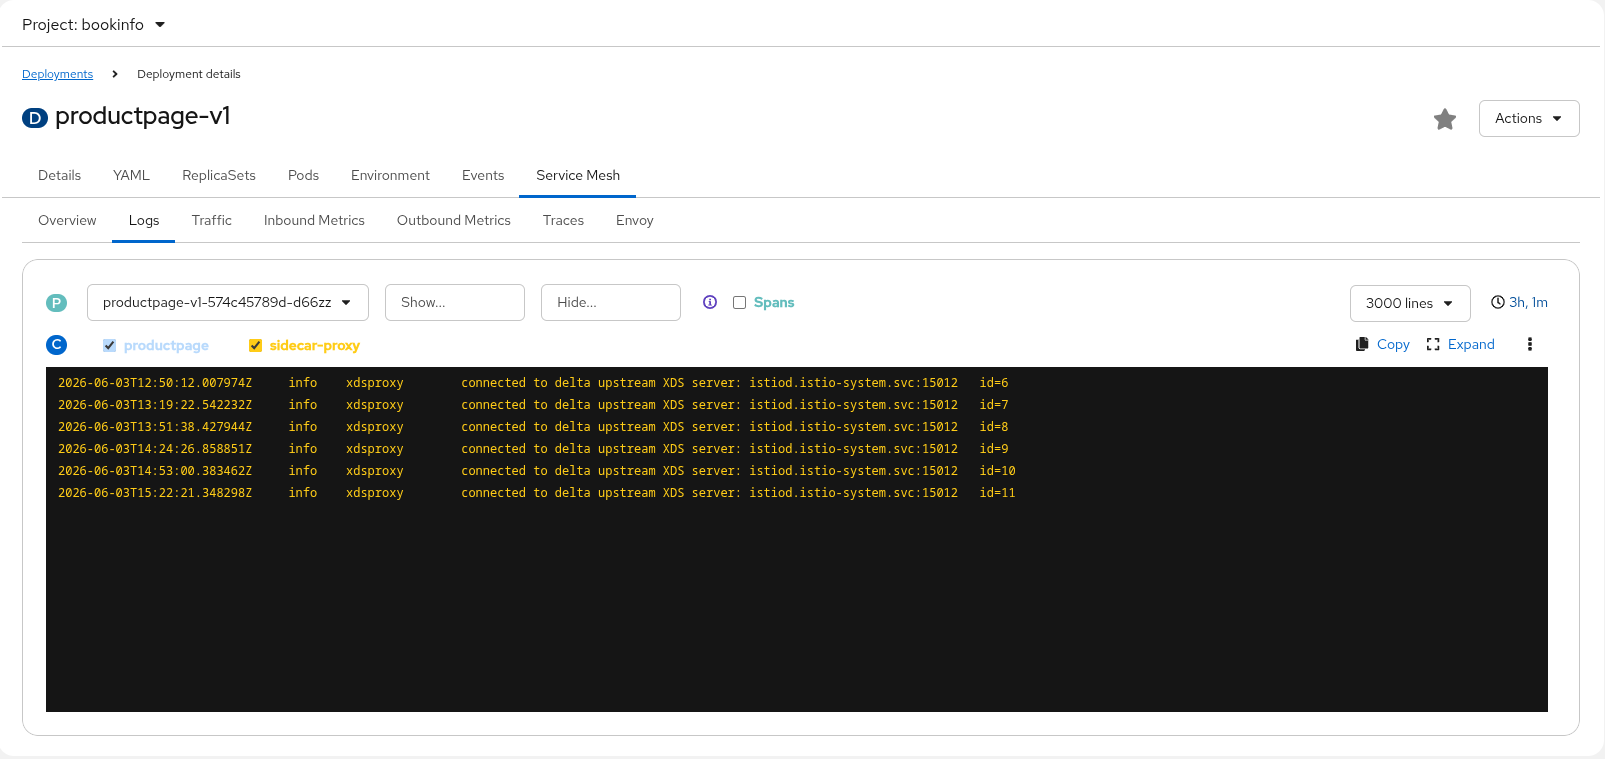
The Workload: Logs sub-tab provides the logs for the workload’s containers. You can view container logs individually or in a unified fashion, ordered by log time. This is especially helpful to see how the Envoy sidecar proxy logs relate to your workload’s application logs. You can enable the tracing span integration which then allows you to see which logs correspond to trace spans.
Workload: Metrics
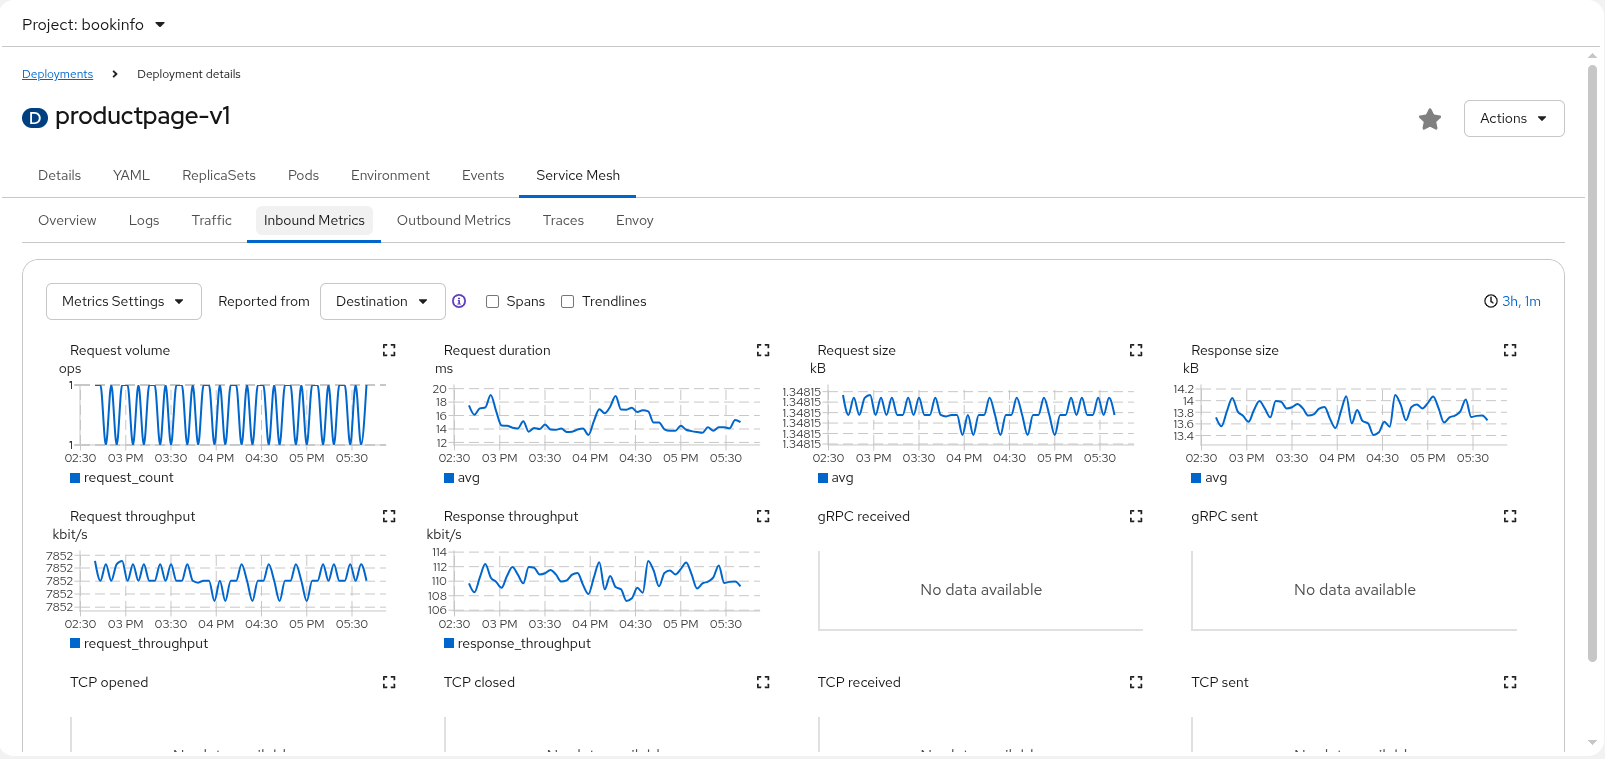
You can see both inbound and outbound metric graphs in the corresponding sub-tabs. All the workload metrics can be displayed here, providing you with a detail view of the performance of your workload. You can enable the tracing span integration which allows you to see which spans occurred at the same time as the metrics. You can then click on a span marker in the graph to view the specific spans associated with that timeframe.
Workload: Traces
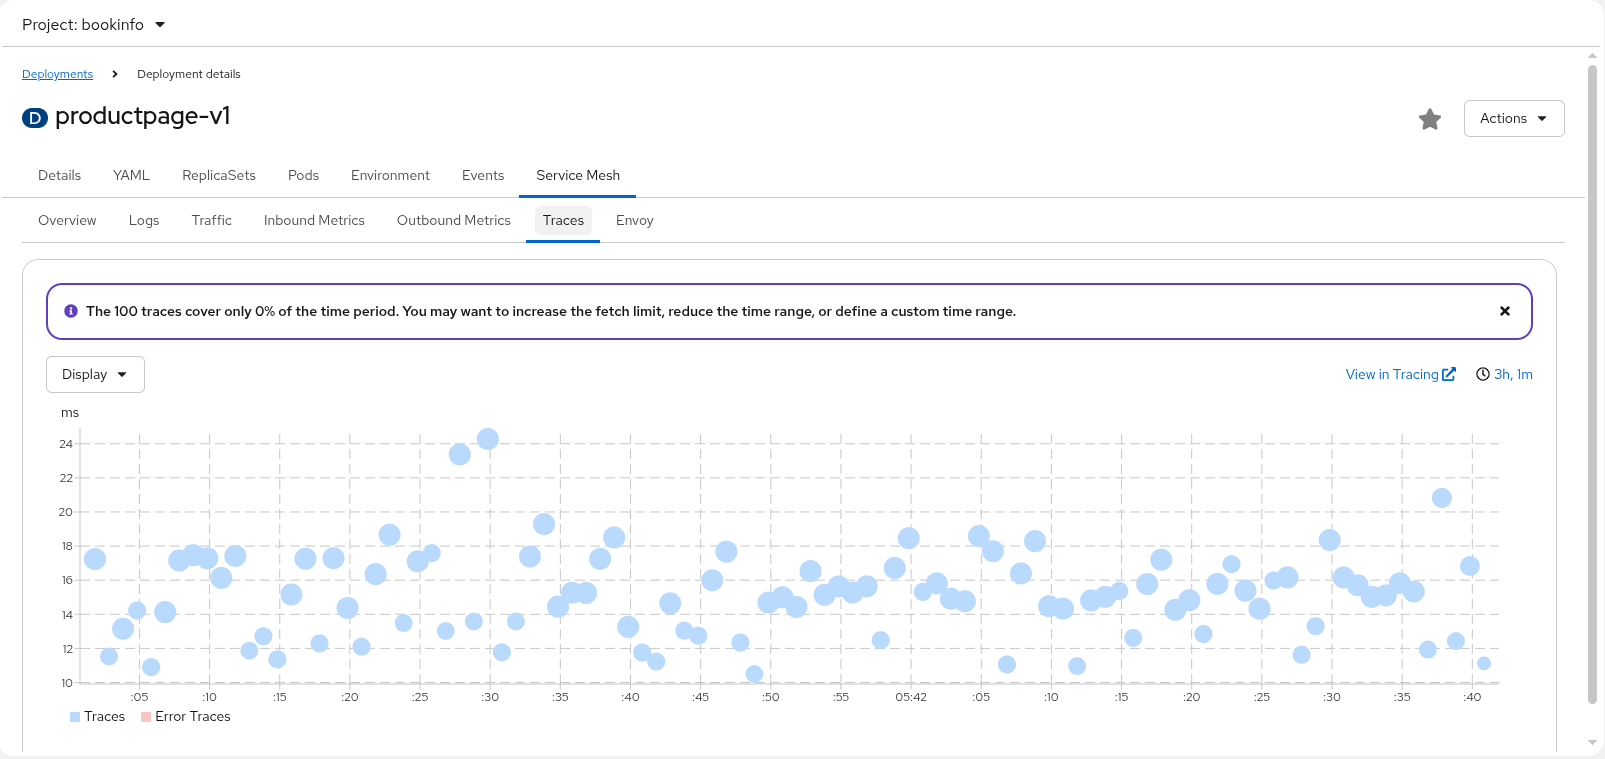
The Traces sub-tab provides a chart showing the trace spans collected over the given timeframe. Click on a bubble to drill down into those trace spans; the trace spans can provide you the most low-level detail within your workload application, down to the individual request level.
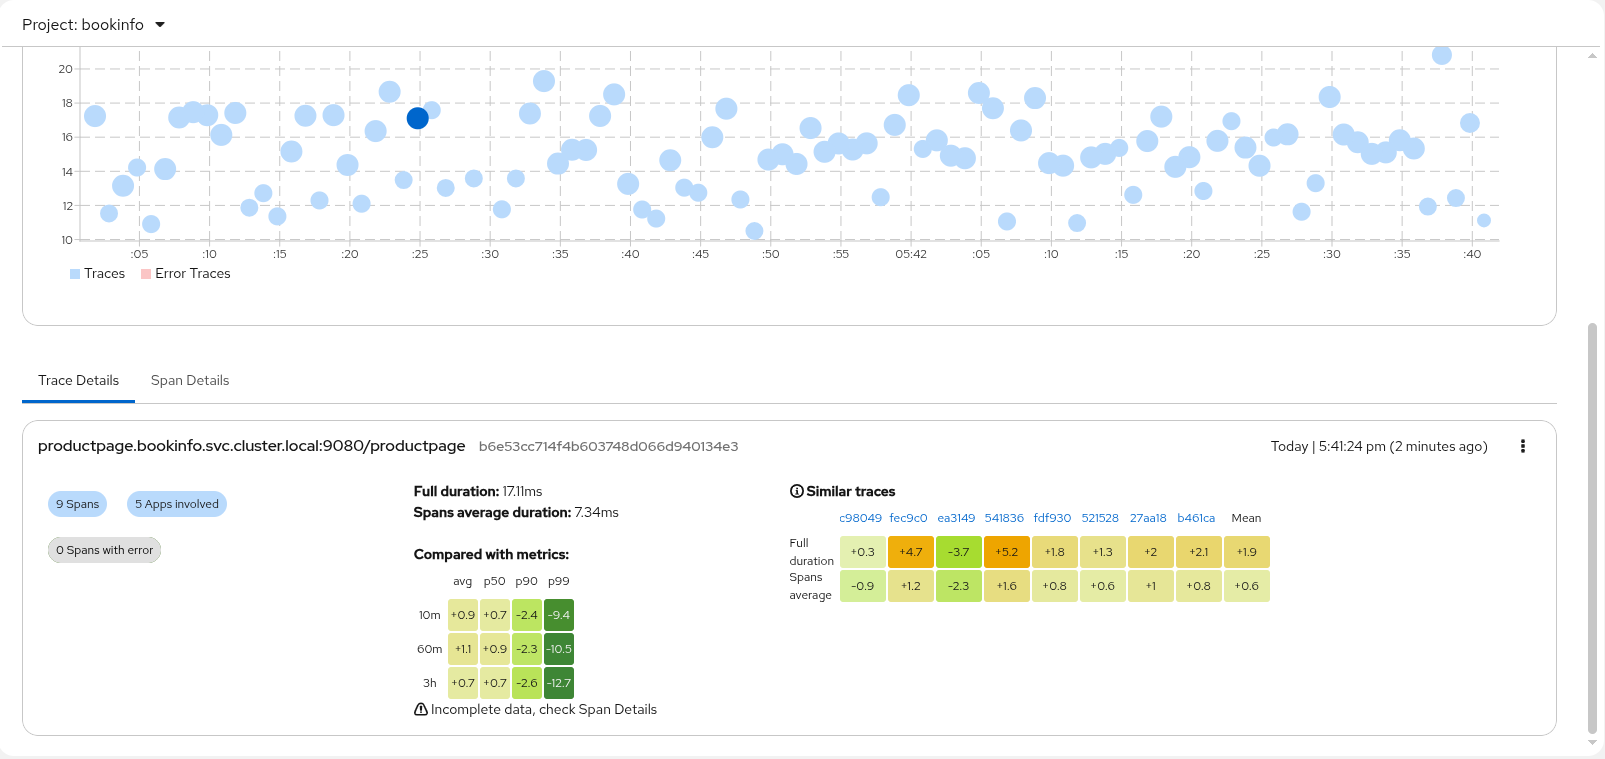
The trace details view will give further details, including heatmaps that provide you with a comparison of one span in relation to other requests and spans in the same timeframe.
When the OpenShift tracing UI plugin is enabled, Kiali will try to auto discover the plugin settings and the View in Tracing Kiali link will redirect to the plugin (for Kiali 2.8.0+).
If the plugin config needs to be adjusted, the following settings should be included in the plugin-conf ConfigMap:
{
  ...
  "observability": {
    "instance": "sample",
    "namespace": "tempo",
    "tenant": "default"
  }
}
Workload: Envoy
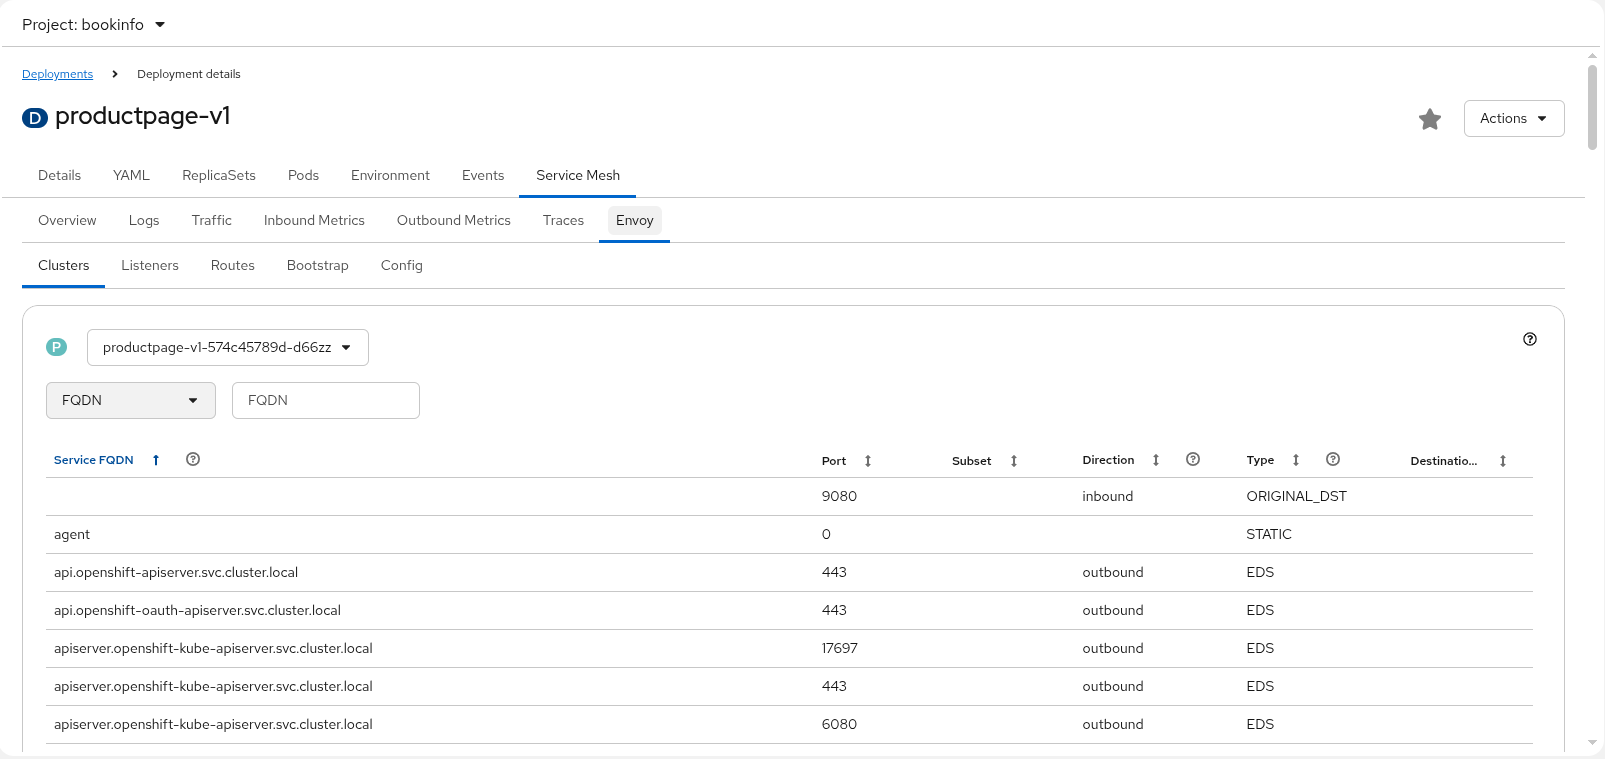
The Envoy sub-tab provides information about the Envoy sidecar configuration. This is useful when you need to dig down deep into the sidecar configuration when debugging things such as connectivity issues.
Application Details
The Applications detail page provides mesh-related detail for the selected application, including a localized topology graph, traffic information, inbound metrics, and traces. The detail page is accessible both from the OSSMC Applications list page and from graph node navigation.
Service Details
The Services detail view has a tab Service Mesh that provides mesh-related detail for the selected service. The details are grouped into several sub-tabs: Overview, Traffic, Inbound Metrics, Traces. These sub-tabs are similar in nature as the Workload sub-tabs with the same names and serve the same functions.
Project Details
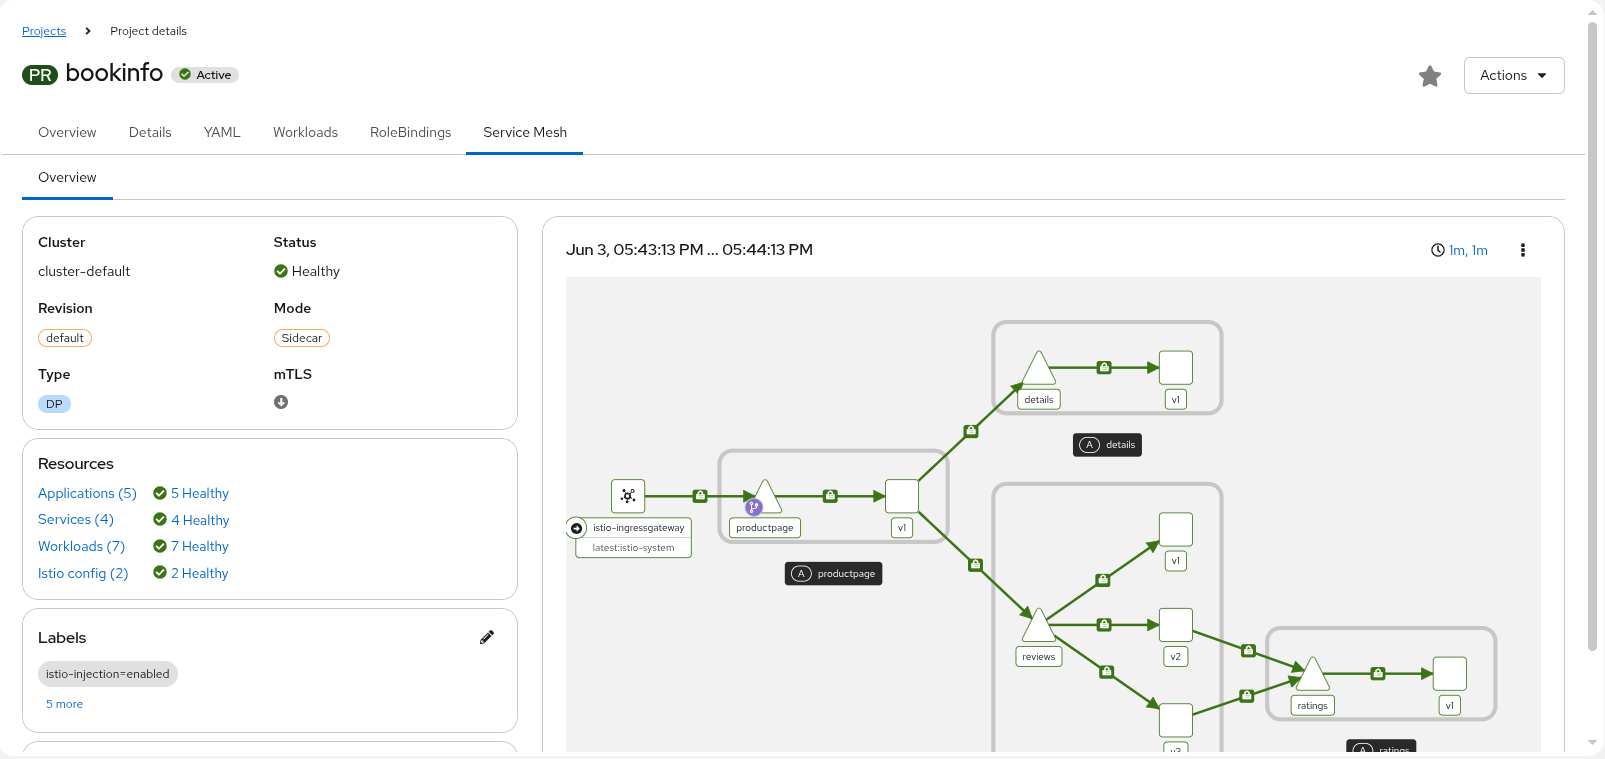
The Projects detail view has a tab Service Mesh that provides mesh-related detail for that project with a split-panel layout showing project attributes, resource links, health information, and a namespace-scoped traffic minigraph.
Istio Config Details
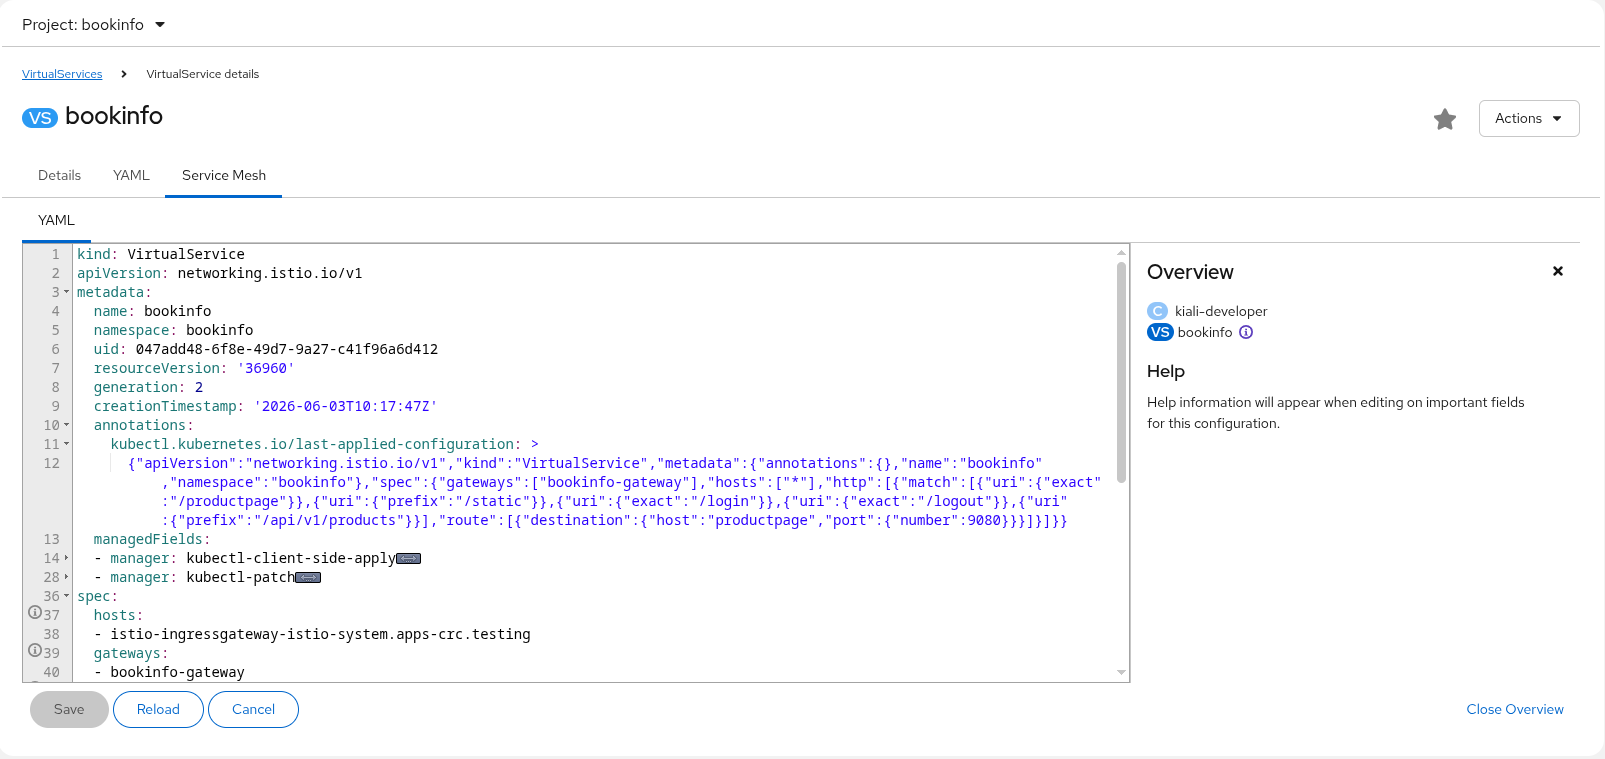
The detail pages for Istio configuration resources (such as VirtualService, DestinationRule, Gateway, AuthorizationPolicy, and others) have a Service Mesh tab that shows an overview and validation status for the resource.