This is the multi-page printable view of this section. Click here to print.
FAQ
Frequently Asked Questions about Kiali.
Need More Than Community Support? Enterprise support is provided by Red Hat.
- 1: Ambient
- 2: Authentication
- 3: Distributed Tracing
- 4: General
- 5: Graph
- 6: Installation
- 7: Istio Component Status
- 8: Performance and Scalability
- 9: Validations
1 - Ambient
Why can’t I see the traffic graph when not using a Waypoint?
There can be multiple reasons, but here are some troubleshooting steps:
- Is the application correctly enrolled in Ambient?
Make sure you see the Ambient label in the control plane card in Kiali, or make sure the namespace is labeled with
istio.io/dataplane-mode=ambient.
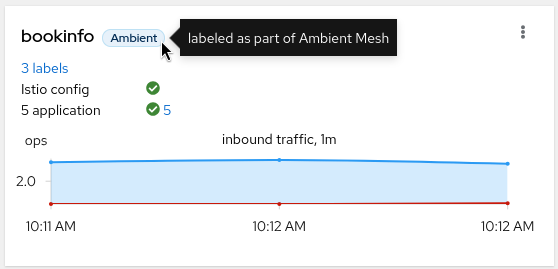
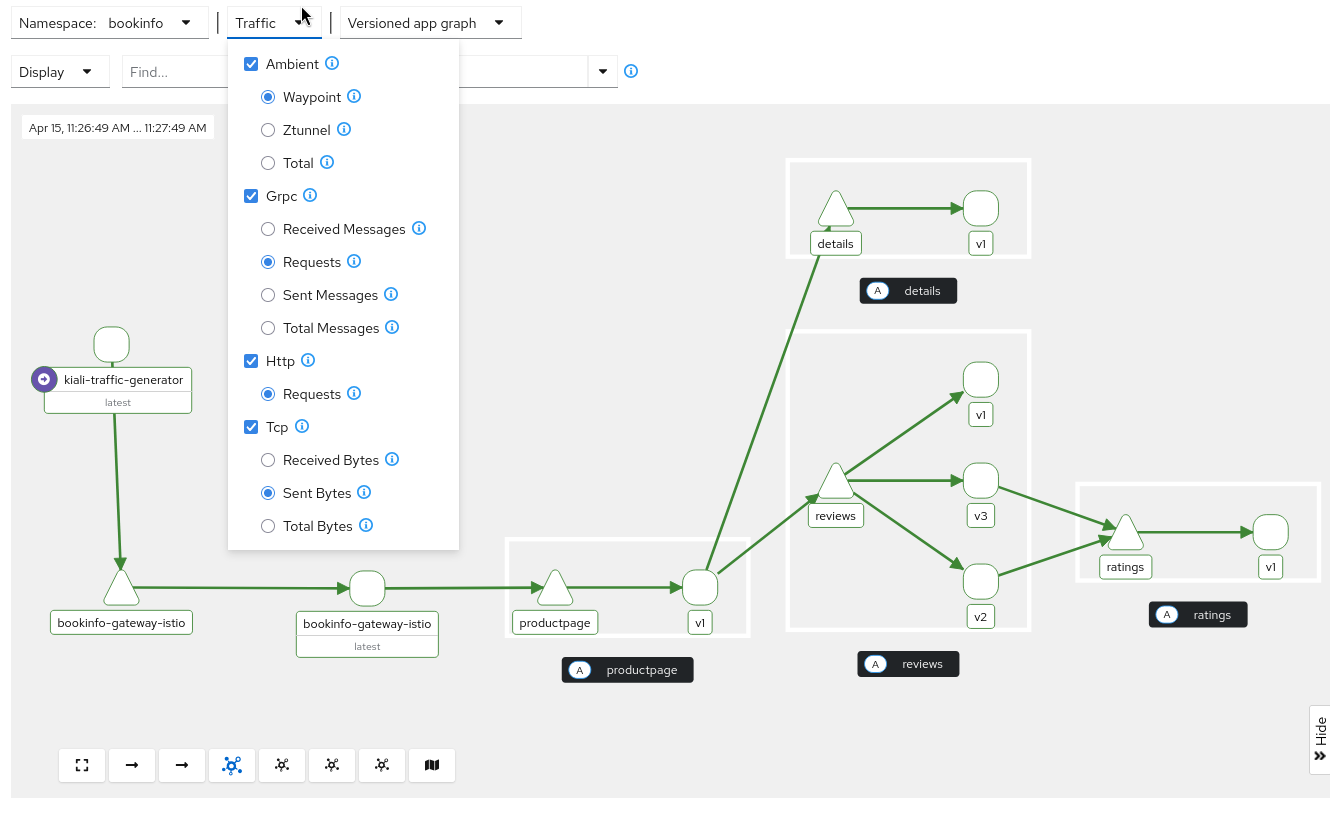
This means that the traffic graph will have L4 metrics if there is traffic. You want to make sure the traffic selectors select ZTunnel as well as the type of traffic (e.g. Tcp) that is flowing:
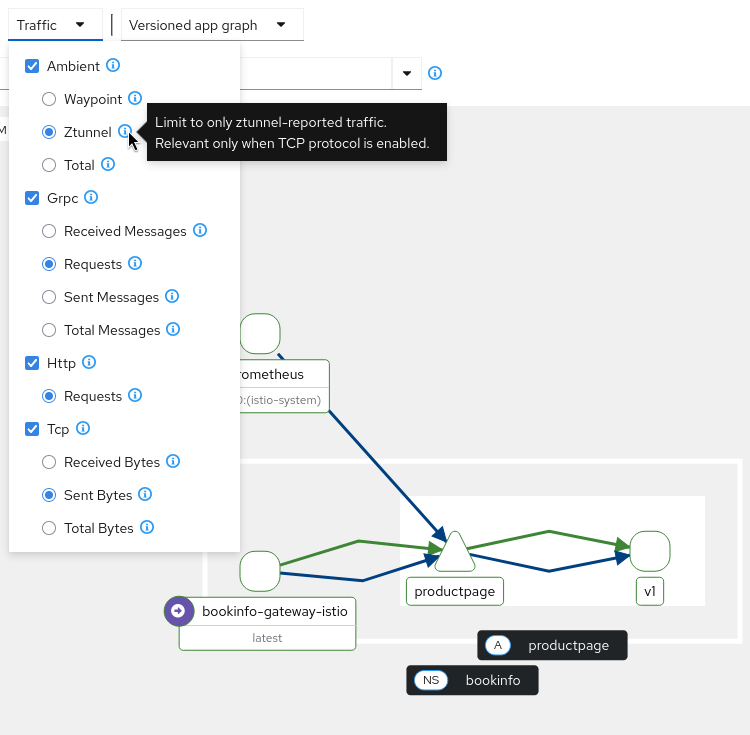
At least, Tcp and Ztunnel traffic should be selected.
- Is there any traffic?
The traffic is created based on the period of time selected. If there is no traffic, the graph won’t be shown. Try to select a longer period of time or enable the Display option to see the idle nodes.

- Are the right metrics generated in Prometheus?
Kiali requires some metrics and attributes to generate the graph. Refer to this FAQ to help you ensure you have the required metrics in your Prometheus server.
For this particular scenario, the most important ones would be the istio_tcp_received_bytes_total and istio_tcp_sent_bytes_total where app=ztunnel. Make sure those metrics exist in Prometheus.
Other graph issues are listed here.
Why can’t I see the traffic graph when the application has a Waypoint proxy?
There can be multiple reasons, but here are some troubleshooting steps:
- Is the application correctly enrolled in Ambient?
Make sure you see the Ambient label in the control plane card in Kiali, or make sure the namespace is labeled with
istio.io/dataplane-mode=ambient.

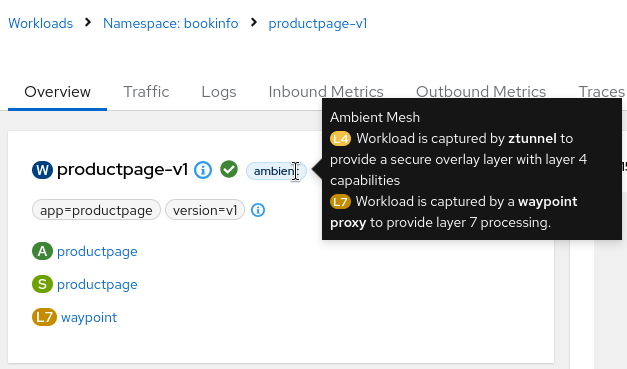
Also, it must be correctly enrolled in a Waypoint proxy. Check the application details and verify that it has the L7 label and a Waypoint proxy link:
- Is there any traffic?
The traffic is created based on the period of time selected. If there is no traffic, the graph won’t be shown. Try to select a longer period of time or enable the Display option to see the idle nodes.

- Are the right metrics generated in Prometheus?
Kiali requires some metrics and attributes to generate the graph. Refer to this FAQ to help you ensure you have the required metrics in your Prometheus server.
For this particular scenario, the most important ones would be the istio_requests_total where reporter=waypoint. Make sure those metrics exist in Prometheus.
Other graph issues are listed here.
Why can’t I see traces?
In Ambient, Ztunnel doesn’t report traces, as the component is limited to L4 metrics. This means that the application should be enrolled in Waypoint to have traces.
If the application is enrolled in a Waypoint proxy, the traces will be created from the Waypoint itself. First, check if the Waypoint proxy is generating traces in the Tracing provider:

If there are no traces, verify:
- If Istio is configured correctly to send traces to the tracing backend
- If the Waypoint proxy is handling traffic
- If the Waypoint proxy is configured correctly to send traces
If there are traces, verify that the Waypoint proxy has traces in Kiali.
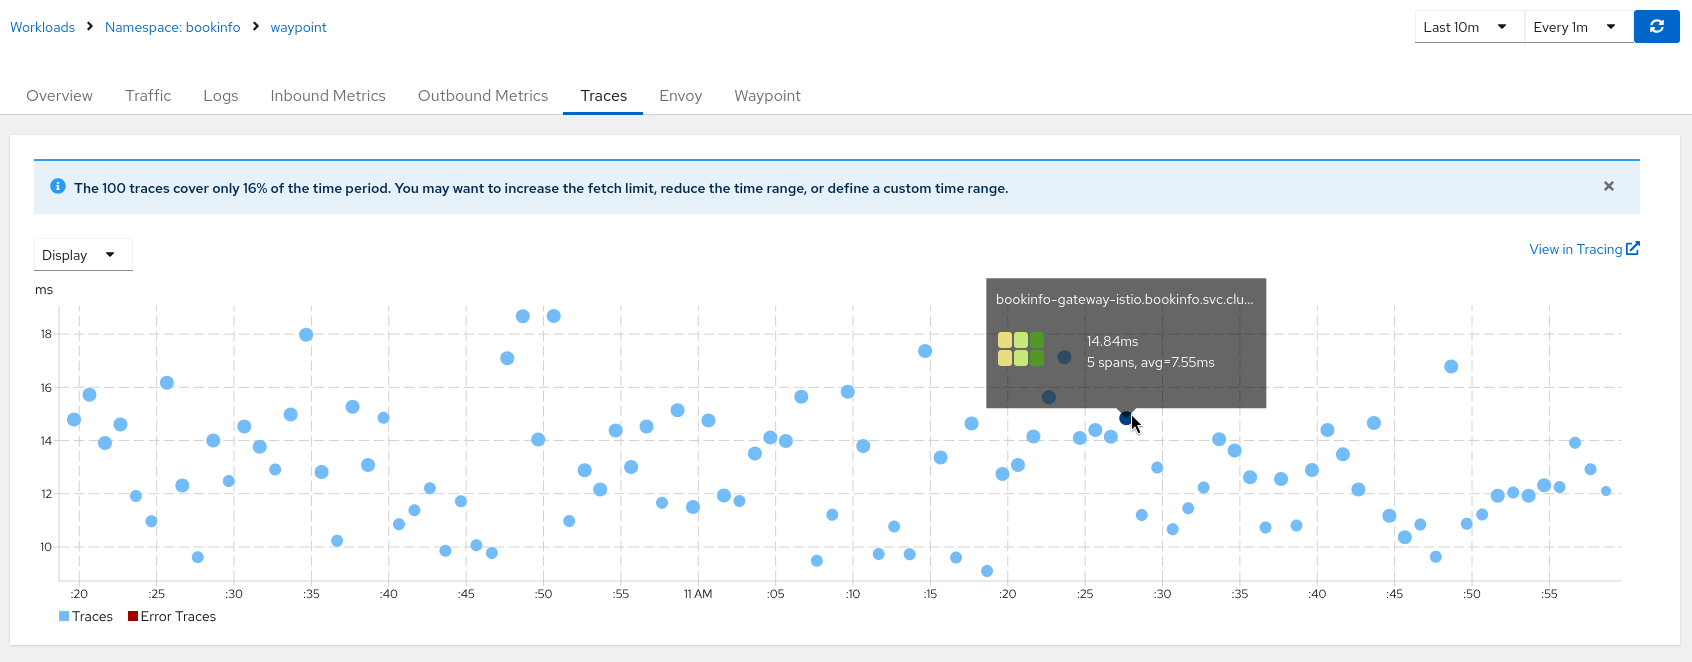
If there are no traces in Kiali, there might be a problem with its distributed tracing configuration. Please refer to the distributed tracing FAQ for additional help.
If there are traces, they will be filtered by the service name to be shown in the application details (for Kiali 2.5.0+).
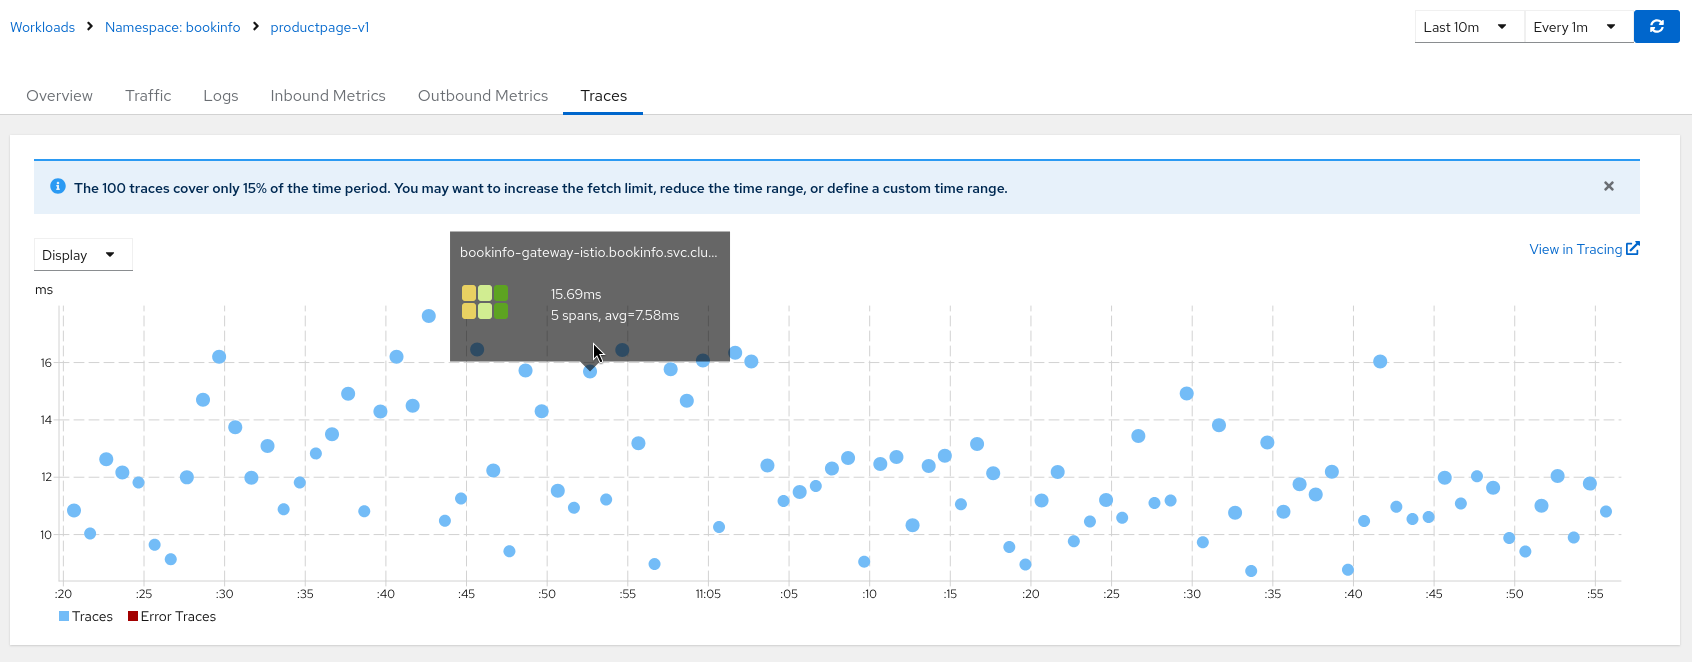
In that case, there are some validations to perform:
- Kiali version is >= 2.5.0
- The service name is the operation name that appears in the traces. Check the Kiali logs for further information.
Why do I see double edges in the Graph?
When the application is part of the Ambient Mesh and also has a Waypoint proxy, it can happen that there are telemetry from L4 (Ztunnel) and L7 (Waypoint).
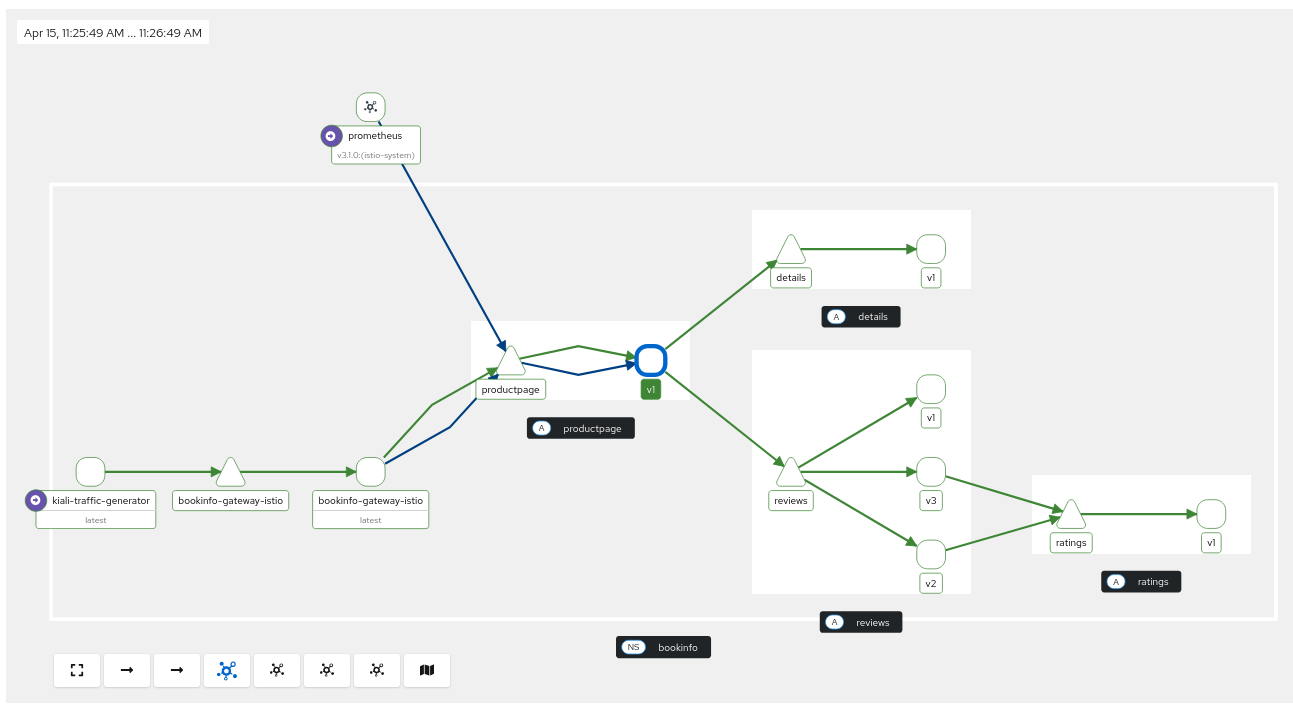
You can filter by just the Waypoint Traffic to remove the same telemetry reported from different components.
Related documentation
2 - Authentication
How to obtain a token when logging in via token auth strategy
When configuring Kiali to use the token auth strategy, it requires users to log into Kiali as a specific user via the user’s service account token. Thus, in order to log into Kiali you must provide a valid Kubernetes token.
Note that the following examples assume you installed Kiali in the istio-system namespace.
For Kubernetes prior to v1.24
You can extract a service account’s token from the secret that was created for you when you created the service account.
For example, if you want to log into Kiali using Kiali’s own service account, you can get the token like this:
kubectl get secret -n istio-system $(kubectl get sa kiali-service-account -n istio-system -o "jsonpath={.secrets[0].name}") -o jsonpath={.data.token} | base64 -d
For Kubernetes v1.24+
You can request a short lived token for a service account by issuing the following command:
kubectl -n istio-system create token kiali-service-account
Using the token
Once you obtain the token, you can go to the Kiali login page and copy-and-paste that token into the token field. At this point, you have logged into Kiali with the same permissions as that of the Kiali server itself (note: this gives the user the permission to see everything).
Create different service accounts with different permissions for your users to use. Each user should only have access to their own service accounts and tokens.
How to configure the originating port when Kiali is served behind a proxy (OpenID support)
When using OpenID strategy for authentication and deploying Kiali behind a reverse proxy or a load balancer, Kiali needs to know the originating port of client requests. You may need to setup your proxy to inject a X-Forwarded-Port HTTP header when forwarding the request to Kiali.
For example, when using an Istio Gateway and VirtualService to expose Kiali, you could use the headers property of the route:
spec:
  gateways:
  - istio-ingressgateway.istio-system.svc.cluster.local
  hosts:
  - kiali.abccorp.net
  http:
  - headers:
      request:
        set:
          X-Forwarded-Port: "443"
    route:
    - destination:
        host: kiali
        port:
          number: 20001
3 - Distributed Tracing
How to know which is the URL for Jaeger or Tempo?
From Kiali 2.11, a new tracing tool in the Mesh page is provided to help troubleshooting and provide possible valid tracing configurations.
Why is Jaeger unreachable or Kiali showing the error “Could not fetch traces”?
Istio components status indicator shows “Jaeger unreachable”:

While on any Tracing page, error “Could not fetch traces” is displayed:
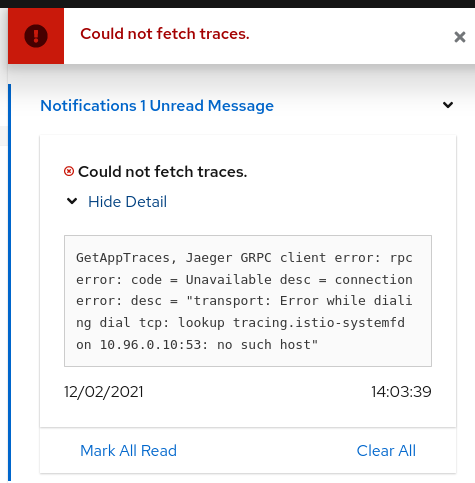
Apparently, Kiali is unable to connect to Jaeger. Make sure tracing is correctly configured in the Kiali CR.
      tracing:
        auth:
          type: none
        enabled: true
        internal_url: 'http://tracing.istio-system/jaeger'
        external_url: 'http://jaeger.example.com/'
        use_grpc: true
You need especially to pay attention to the internal_url field, which is how Kiali backend contacts the Jaeger service. In general, this URL is written using Kubernetes domain names in the form of http://service.namespace, plus a path.
If you’re not sure about this URL, try to find your Jaeger service and its exposed ports:
$ kubectl get services -n istio-system
...
tracing      ClusterIP      10.108.216.102   <none>        80/TCP      47m
...
To validate this URL, you can try to curl its API via Kiali pod, by appending /api/traces to the configured URL (in the following, replace with the appropriate Kiali pod):
$ kubectl exec -n istio-system -it kiali-556fdb8ff5-p6l2n -- curl http://tracing.istio-system/jaeger/api/traces

{"data":null,"total":0,"limit":0,"offset":0,"errors":[{"code":400,"msg":"parameter 'service' is required"}]}
If you see some returning JSON as in the above example, that should be the URL that you must configure.
If instead of that you see some blocks of mixed HTML/Javascript mentioning JaegerUI, then probably the host+port are correct but the path isn’t.
A common mistake is to forget the /jaeger suffix, which is often used in Jaeger deployments.
It may also happen that you have a service named jaeger-query, exposing port 16686, instead of the more common tracing service on port 80. In that situation, set internal_url to http://jaeger-query.istio-system:16686/jaeger.
If Jaeger needs an authentication, make sure to correctly configure the auth section.
Note that in general, Kiali will connect to Jaeger via GRPC, which provides better performances. If for some reason it cannot be done (e.g. Jaeger being behind a reverse-proxy that doesn’t support GRPC, or that needs more configuration in that purpose), it is possible to switch back to using the http/json API of Jaeger by setting use_grpc to false.
If for some reason the GRPC connection fails and you think it shouldn’t (e.g. your reverse-proxy supports it, and the non-grpc config works fine), please get in touch with us.
Why can’t I see any external link to Jaeger?
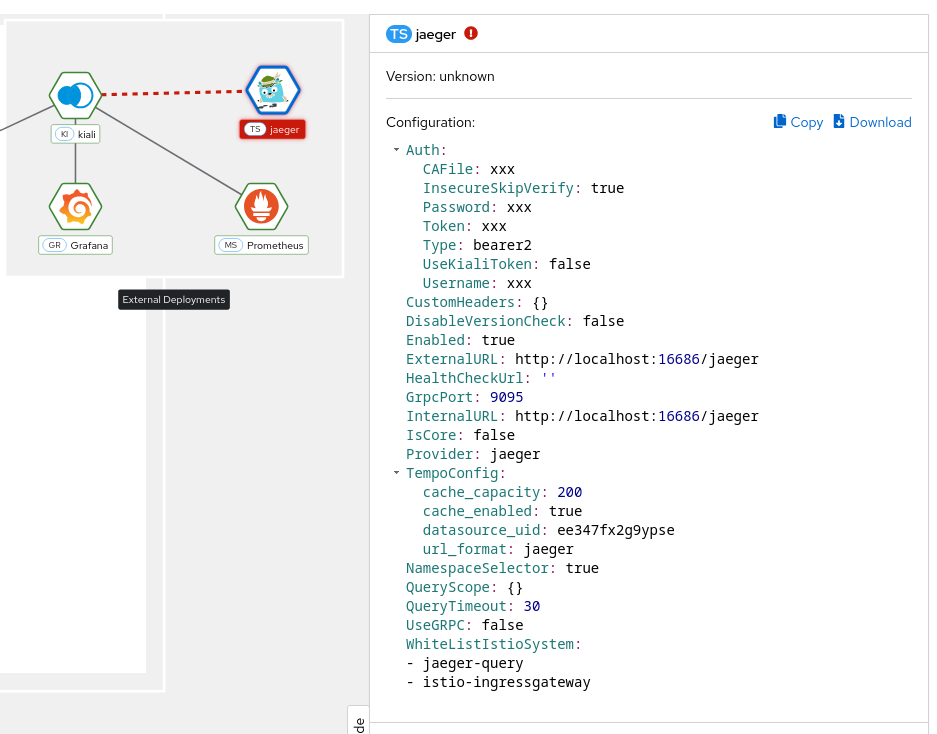
In addition to the embedded integration that Kiali provides with Jaeger, it is possible to show external links to the Jaeger UI. To do so, the external URL must be configured in the Kiali CR.
    tracing:
      # ...
      external_url: "http://jaeger.example.com/"
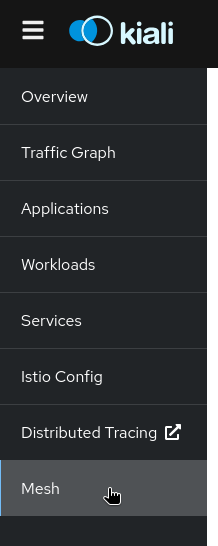
When configured, this URL will be used to generate a couple of links to Jaeger within Kiali. It’s also visible in the Mesh page:
Why do I see an external link instead of Kiali’s own Tracing page?

On the Application detail page, the Traces tab might redirect to Jaeger via an external link instead of showing the Kiali Tracing view. It happens when you have the external_url field configured, but not internal_url, which means the Kiali backend will not be able to connect to Jaeger.
To fix it, configure internal_url in the Kiali CR.
Why do I see “Missing root span” for the root span of some span details on Traces tab?
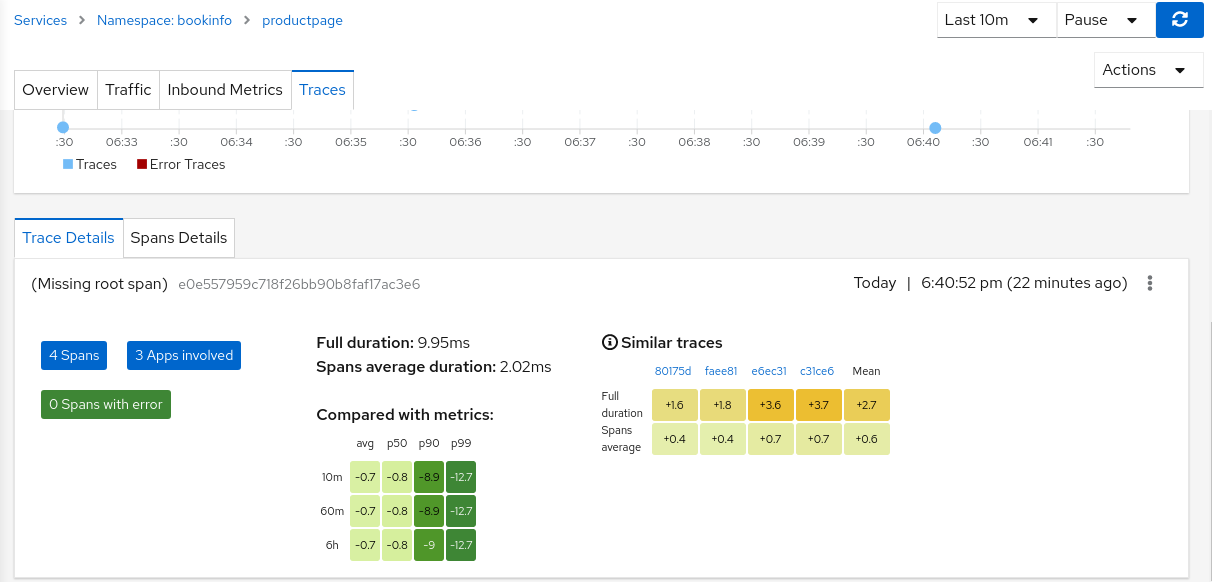
In Traces tab, while clicking on a trace, it shows the details of that trace and information about spans. These details also include the root span information. But for the traces for traffic that is not comming from ingress-gateway, the root span information is not available in Jaeger, thus Kiali is displaying “Missing root span” for those traces’ details and tooltips in Traces tab and in Graph pages.
Why do I see “error reading server preface: http2: frame too large” error when Kiali is not able to fetch Traces?
Sometimes this error can occur when there is a problem in the configuration and there is an http URL configured but Kiali is configured to use grpc. For example:
use_grpc: true
internal_url: "http://jaeger_url:16686/jaeger"
That should be solved when use_grpc: false or using the grpc port internal_url: "http://jaeger_url:16685/jaeger"
Why do I see “[gRPC Tempo] GetAppTraces, Tracing gRPC client error: rpc error” error when Kiali is not able to fetch Traces in Tempo?
This error can occur when use_grpc is true, but the port is not open/accessible.
Why do I see “invalid character ‘p’ after top-level value” error when Kiali is not able to fetch Traces in Tempo?
The Tempo URL is set in internal_url, but the configuration in Kiali CR for external_services.tracing.provider is not tempo.
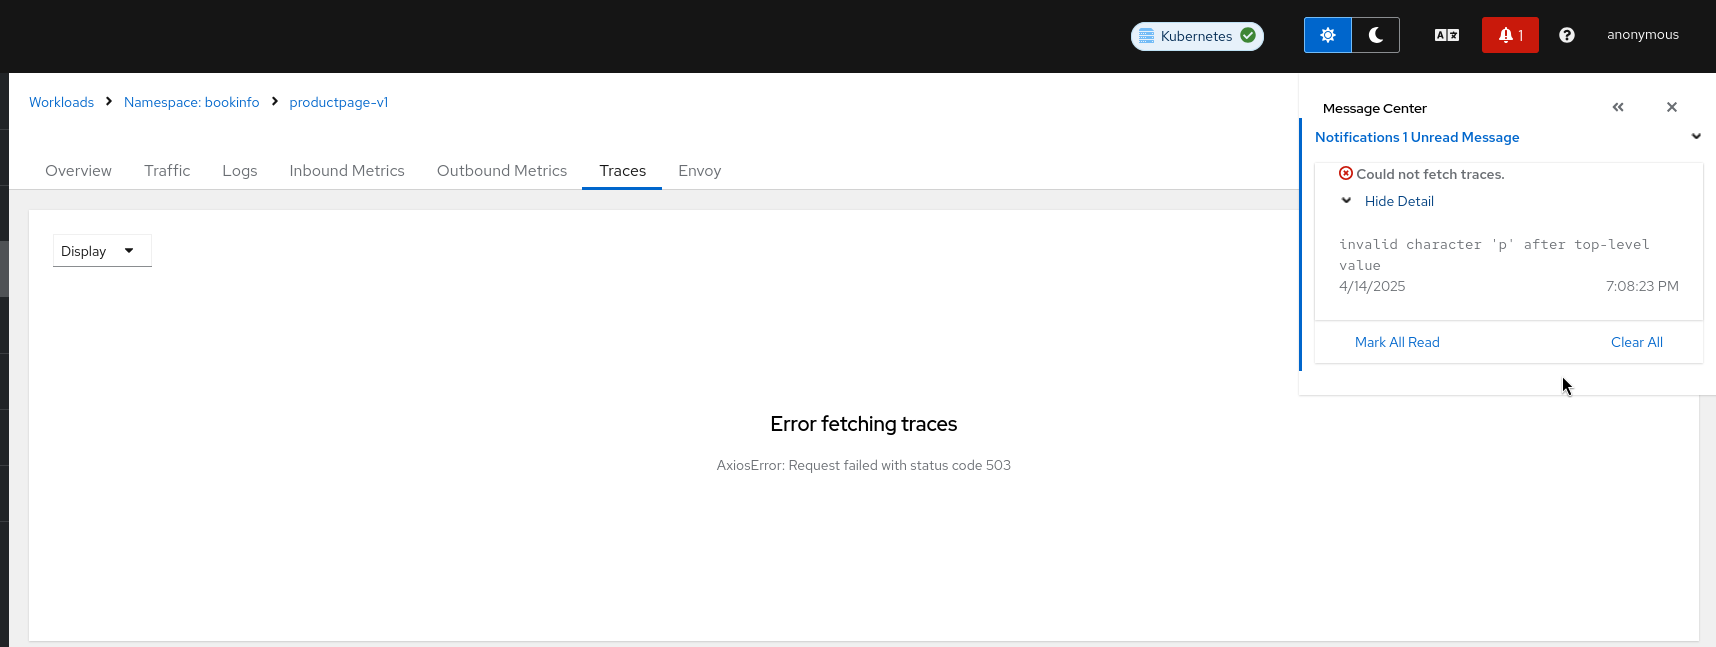
Why do I see “Error fetching traces. AxiosError: Request failed with status code 503” error when Kiali is not able to fetch Traces from Tempo?
This error can occur for several reasons, but it usually means that the internal URL is not the right Tracing API.
Note that Grafana Tempo can also expose a Jaeger API, but the right url needs to be set in the Kiali CR pointing to the Jaeger endpoint.
If that is not the issue, here there are some troubleshooting steps:
- Expand the messages icon to find more information about the error.
- In the Mesh page, check that the tracing provider is reachable.
- In the Mesh page, check the configuration for the tracing provider. Verify the URLs are correct.
- Verify the provider (jaeger/tempo) matches the internal/external URL that is configured.
- Review the Kiali logs and check for specific tracing errors. Might be helpful to set the log level to
debug. - When the log level is set to debug, Kiali will log the complete trace query. It might be useful to test it from a cURL to verify if that is reachable from the Kiali pod and it has results.
Sometimes Tempo is configured outside the Kiali namespace, so there might be additional issues like reachability, certificates setup, etc.
Why can’t I see the link “View in Tracing” when using Tempo?
Some settings need to be configured in order to enable the external_url.
When tempo is set in the Kiali CR external_services.tracing.provider, the default url_format is grafana, and external_services.tracing.external_url needs to be set accordingly.
tracing:
  provider: "tempo"
  external_url: "http://external-grafana-url"
  tempo_config:
    url_format: "grafana"
When url_format is set to jaeger, the external_services.tracing.external_url needs to be set as well:
tracing:
  provider: "tempo"
  external_url: "https://tempo-tempo-query-frontend-tempo.apps-crc.testing/"
  tempo_config:
    url_format: "jaeger"
When url_format is set to openshift, there are additional parameters to set:
tracing:
  provider: "tempo"
  external_url: "https://console-openshift-console.apps-crc.testing/"
  tempo_config:
    name: "sample"
    namespace: "tempo"
    tenant: "default"
    url_format: "openshift"
Where:
- name: is the name of the Tempo instance
- namespace where the Tempo instance is installed
- tenant: The tenant name where the traces are sent
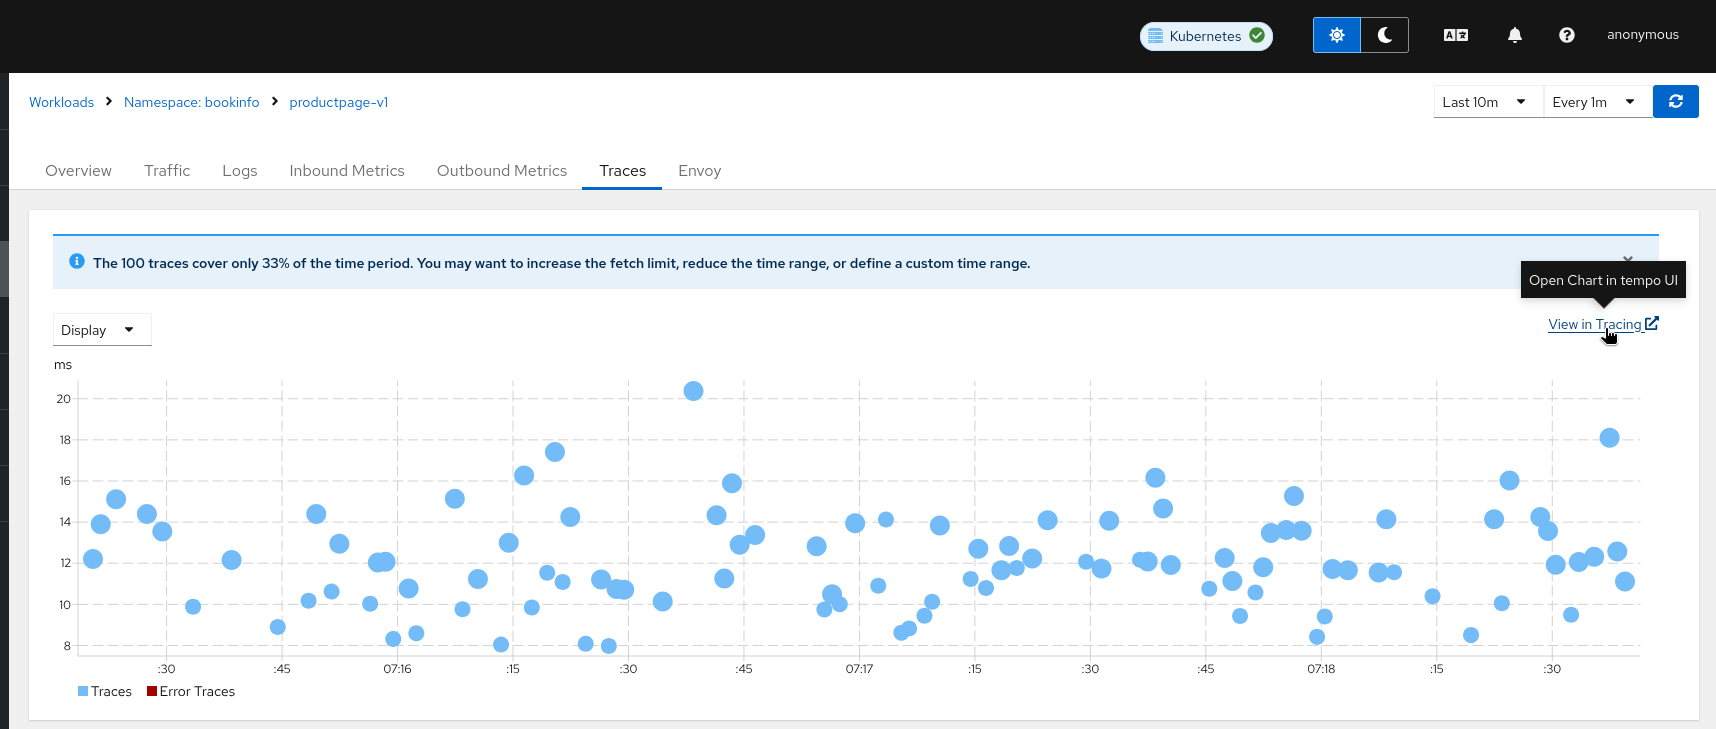
For OSSMC, when the tracing plugin is enabled, it will redirect automatically to the Tracing UI plugin.
Why can’t I see traces and there are no errors?
First thing to verify will be if Istio is correctly configured to send traces and verify in the Tracing backend if traces do exist.
If the tracing is configured correctly, verify in the tracing backend if there are traces for the services in the Mesh that you are expecting to have traces.
By default, Kiali will search for the service name using service.namespace, but if the traces are create within the namespace selector, the following CR setting should be changed:
tracing:
  namespace_selector: false
For further Tempo configuration options, take a look at the Tempo configuration page
How do I modify the trace limit?
The trace limit can be changed from the UI, and it is available as a Display menu option:
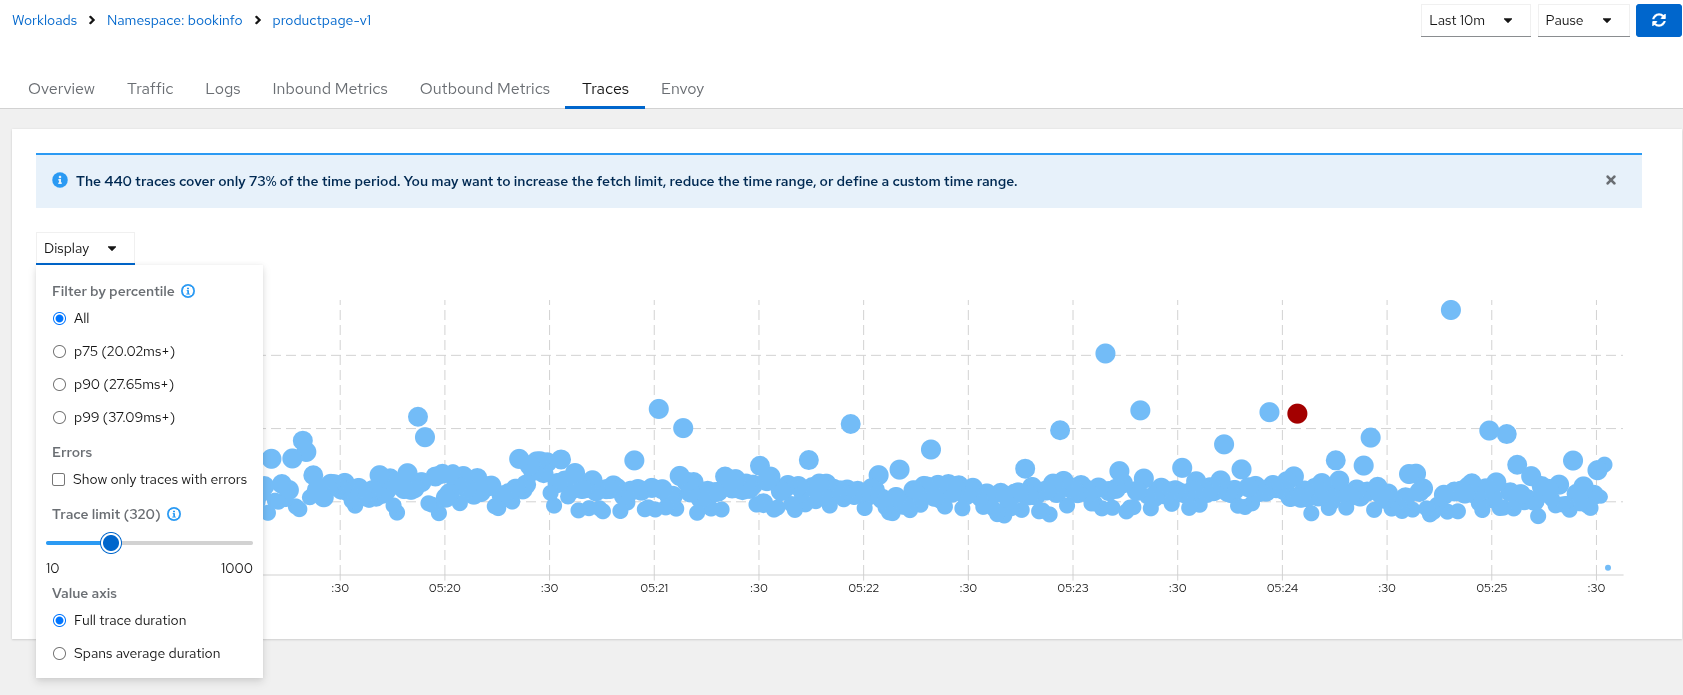
The default value (Set to 100) can be modified in the Kiali CR setting kiali_feature_flags.ui_defaults.tracing.limit.
Why do I see a Jaeger gRPC client error: i/o timeout?
If you are using Tempo Operator 0.20, there is a bug where the gRPC port is closed and Kiali shows an error like:
Could not fetch traces.
GetAppTraces, Jaeger GRPC client error: rpc error: code = Unavailable desc = connection error: desc = "transport: Error while dialing: dial tcp 172.30.14.34:16685: i/o timeout"
Other common causes are that the gRPC port is not exposed by the tracing Service, is blocked by a NetworkPolicy/firewall, or that internal_url is pointing to the wrong host/port.
4 - General
How do I determine what version I am running?
There are several components within the Istio/Kiali infrastructure that have version information.
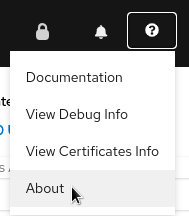
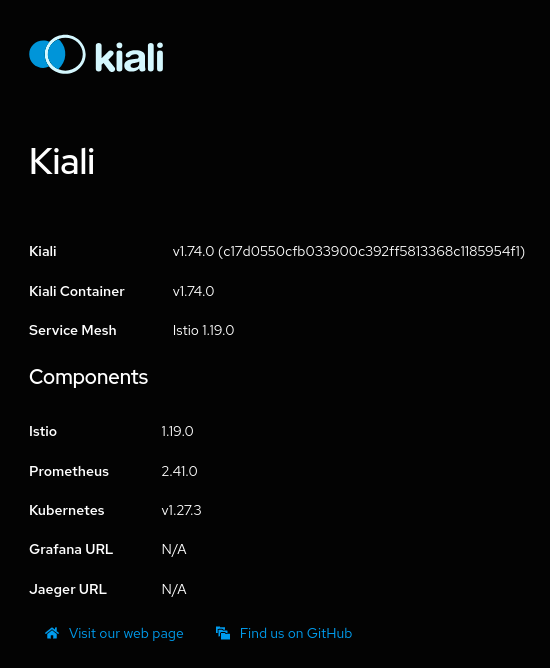
- To see the Kiali version for the instance running your UI: Go to the Help dropdown menu found at the top-right of the Kiali Console window and select “About”. This will pop up the About dialog box which displays detailed information for the current Kiali instance. From here you can also link to the Mesh page.
Help dropdown menu:
The Kiali About box:
- To see version information for the infrastruction components in your mesh: Go to the main menu and select the “Mesh” page option. This will bring you to a graphical representation of your mesh. The default side-panel will present a summary of the infrastructure components and, if possible to determine, their versions. This will include things like Istio, Prometheus, etc. You can also select graph nodes to see any further details that may be available for that component.
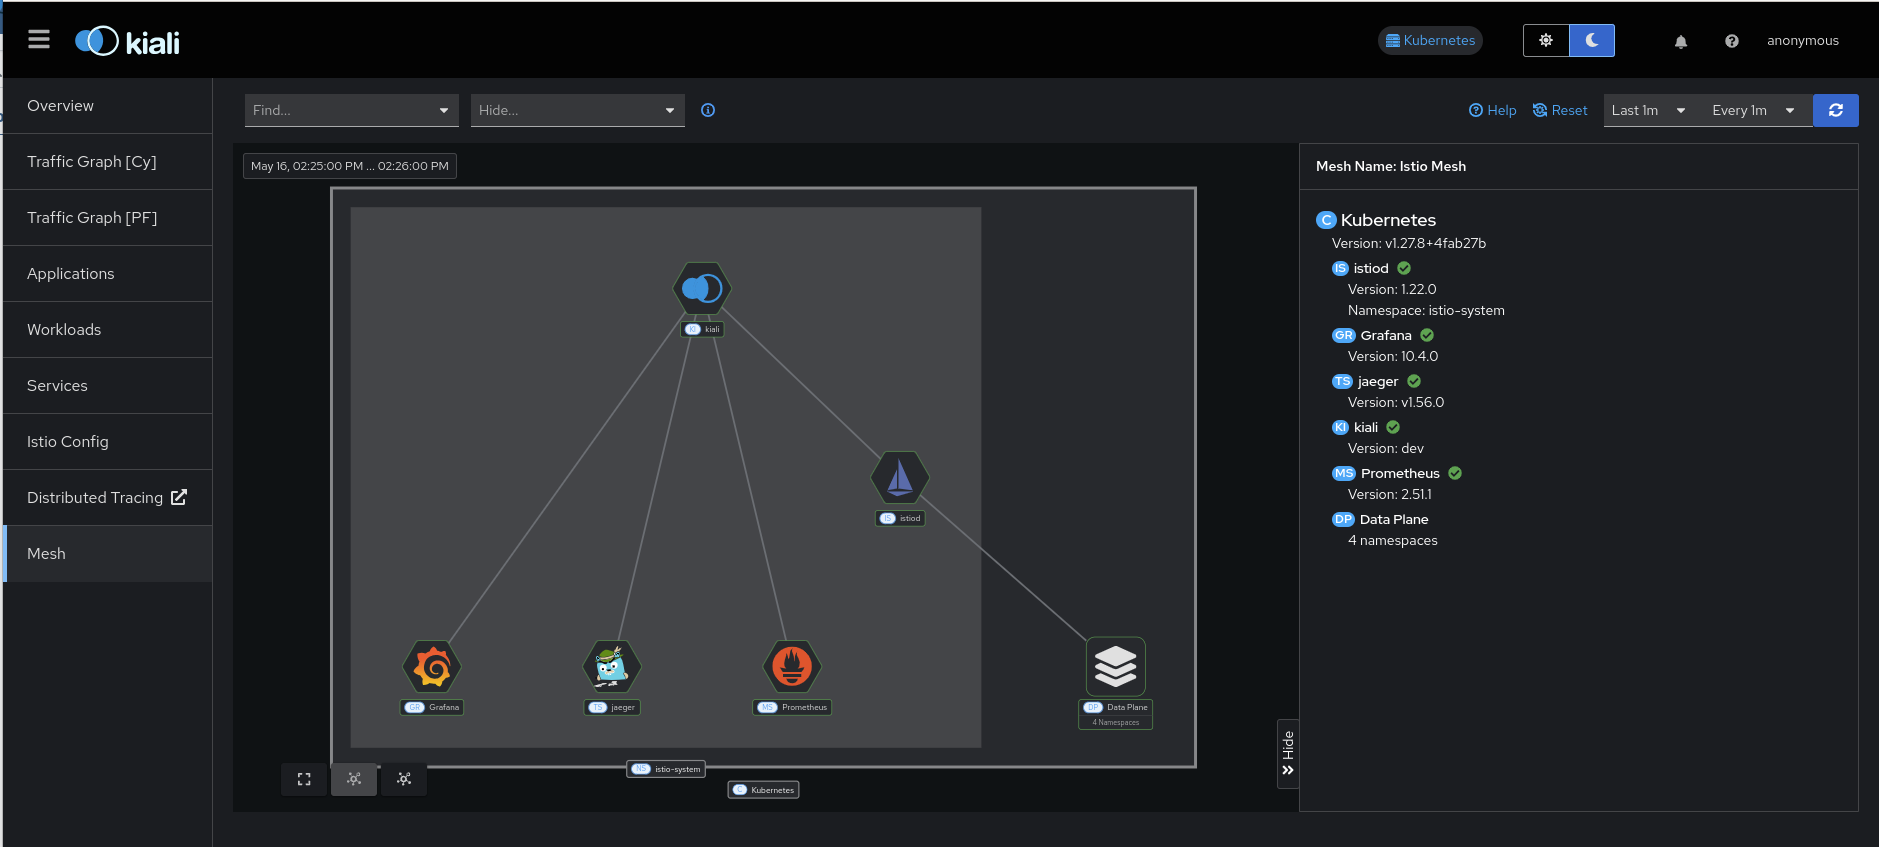
- You can also get much of this same version information in JSON format. From the command line, run something like
curlto obtain the version information from the/apiendpoint. For example, expose Kiali via port-forwarding socurlcan access it:
kubectl port-forward -n istio-system deploy/kiali 20001:20001
And then request the version information via curl:
curl http://localhost:20001/kiali/api
The version information will be provided in a JSON format such as this:
{
  "status": {
    "Kiali commit hash": "c17d0550cfb033900c392ff5813368c1185954f1",
    "Kiali container version": "v1.74.0",
    "Kiali state": "running",
    "Kiali version": "v1.74.0",
    "Mesh name": "Istio",
    "Mesh version": "1.19.0"
  },
  "externalServices": [
    {
      "name": "Istio",
      "version": "1.19.0"
    },
    {
      "name": "Prometheus",
      "version": "2.41.0"
    },
    {
      "name": "Kubernetes",
      "version": "v1.27.3"
    },
    {
      "name": "Grafana"
    },
    {
      "name": "Jaeger"
    }
  ],
  "warningMessages": [],
  "istioEnvironment": {
    "isMaistra": false,
    "istioAPIEnabled": true
  }
}
- Obtain the container image being used by the Kiali Server pod:
kubectl get pods --all-namespaces -l app.kubernetes.io/name=kiali -o jsonpath='{.items..spec.containers[*].image}{"\n"}'
This will result in something like: quay.io/kiali/kiali:v1.74.0
- Obtain the container image being used by the Kiali Operator pod:
kubectl get pods --all-namespaces -l app.kubernetes.io/name=kiali-operator -o jsonpath='{.items..spec.containers[*].image}{"\n"}'
This will result in something like: quay.io/kiali/kiali-operator:v1.74.0
- Obtain the container image being used by the istiod pod:
kubectl get pods --all-namespaces -l app=istiod -o jsonpath='{.items..spec.containers[*].image}{"\n"}'
This will result in something like: gcr.io/istio-release/pilot:1.19.0
- If Kiali and/or Istio are installed via helm charts, obtain the helm chart version information:
helm list --all-namespaces
As an example, if you installed Kiali Operator via helm, this will result in something like:
NAME             NAMESPACE        REVISION   UPDATED                                   STATUS     CHART                   APP VERSION
kiali-operator   kiali-operator   1          2023-09-26 09:52:21.266593138 -0400 EDT   deployed   kiali-operator-1.74.0   v1.74.0
Why is the Workload or Application Detail page so slow or not responding?
We have identified a performance issue that happens while visiting the Workload or Application detail page, related to discovering metrics in order to show custom dashboards. Both Kiali and Prometheus may run out of memory.
The immediate workaround is to disable dashboards discovery:
spec:
  external_services:
    custom_dashboards:
      discovery_enabled: "false"
It’s also recommended to consider a more robust setup for Prometheus, like the one described in this Istio guide (see also this Kiali blog post), in order to decrease the metrics cardinality.
What do I need to run Kiali in a private cluster?
Private clusters have higher network restrictions. Kiali needs your cluster to allow TCP traffic between the Kubernetes API service and the Istio Control Plane namespace, for both the 8080 and 15000 ports. This is required for features such as Health and Envoy Dump to work as expected.
Make sure that the firewalls in your cluster allow the connections mentioned above.
Check section Google Kubernetes Engine (GKE) Private Cluster requirements in the Installation Guide.
Does Kiali support Internet Explorer?
No version of Internet Explorer is supported with Kiali. Users may experience some issues when using Kiali through this browser.
Kiali does not work - What do i do?
If you are hitting a problem, whether it is listed here or not, do not hesitate to open a GitHub Discussion to ask about your situation. If you are hitting a bug, or need a feature, you can vote (using emojis) for any existing bug or feature request found in the GitHub Issues. This will help us prioritize the most needed fixes or enhancements. You can also create a new issue.
See also the Community page which lists more contact channels.
How do I obtain the logs for Kiali?
Kiali operator logs can be obtained from within the Kiali operator pod. For example, if the operator is installed in the kiali-operator namespace:
KIALI_OPERATOR_NAMESPACE="kiali-operator"
kubectl logs -n ${KIALI_OPERATOR_NAMESPACE} $(kubectl get pod -l app=kiali-operator -n ${KIALI_OPERATOR_NAMESPACE} -o name)
Kiali server logs can be obtained from within the Kiali server pod. For example, if the Kiali server is installed in the istio-system namespace:
KIALI_SERVER_NAMESPACE="istio-system"
kubectl logs -n ${KIALI_SERVER_NAMESPACE} $(kubectl get pod -l app=kiali -n ${KIALI_SERVER_NAMESPACE} -o name)
Note that you can configure the logger in the Kiali Server.
Which Istio metrics and attributes are required by Kiali?
To reduce Prometheus storage some users want to customize the metrics generated by Istio. This can break Kiali if the pruned metrics and/or attributes are used by Kiali in its graph or metric features.
Kiali currently requires the following metrics and attributes:
| Metric | Notes |
|---|---|
| container_cpu_usage_seconds_total | used to graph cpu usage in the control plane overview card |
| container_memory_working_set_bytes | used to graph memory usage in the control plane overview card |
| process_cpu_seconds_total | used to graph cpu usage in the control plane overview card (if the container metric is not available); used in the Istiod application metrics dashboard |
| process_resident_memory_bytes | used to graph memory usage in the control plane overview card (if the container metric is not available) |
Istio metrics and attributes:
| Metric | Notes |
|---|---|
| istio_build | used to display ztunnel version information |
| istio_requests_total | used throughout Kiali and the primary metric for http/grpc request traffic |
| istio_request_bytes_bucket | used in metric displays to calculate throughput percentiles |
| istio_request_bytes_count | used in metric displays to calculate throughput avg |
| istio_request_bytes_sum | used throughout Kiali for throughput calculation |
| istio_request_duration_milliseconds_bucket | used throughout Kiali for response-time calculation |
| istio_request_duration_milliseconds_count | used throughout Kiali for response-time calculation |
| istio_request_duration_milliseconds_sum | used throughout Kiali for response-time calculation |
| istio_request_messages_total | used throughout Kiali for grpc sent message traffic |
| istio_response_bytes_bucket | used in metric displays to calculate throughput percentiles |
| istio_response_bytes_count | used in metric displays to calculate throughput avg |
| istio_response_bytes_sum | used throughout Kiali for throughput calculation |
| istio_response_messages_total | used throughout Kiali for grpc received message traffic |
| istio_tcp_connections_closed_total | used in metric displays |
| istio_tcp_connections_opened_total | used in metric displays |
| istio_tcp_received_bytes_total | used throughout Kiali for tcp received traffic |
| istio_tcp_sent_bytes_total | used throughout Kiali for tcp sent traffic |
| pilot_info | used as discovery metric for the Istiod dashboard |
| pilot_proxy_convergence_time_sum | used in control plane overview card to show the average proxy push time |
| pilot_proxy_convergence_time_count | used in control plane overview card to show the average proxy push time; used in the Istiod application metrics dashboard |
| pilot_services | used in the Istiod application metrics dashboard |
| pilot_xds | used in the Istiod application metrics dashboard |
| pilot_xds_pushes | used in the Istiod application metrics dashboard |
| workload_manager_active_proxy_count | used for ztunnel workload manager active proxy count |
| Attribute | Metric | Notes |
|---|---|---|
| app | istio_tcp_received_bytes_total | used for filtering ztunnel traffic in TCP queries; also included in TCP traffic groupBy clauses |
| istio_tcp_sent_bytes_total | used for filtering ztunnel traffic in TCP queries; also included in TCP traffic groupBy clauses | |
| connection_security_policy | istio_requests_total | used only when graph Security display option is enabled |
| istio_tcp_received_bytes_total | used only when graph Security display option is enabled | |
| istio_tcp_sent_bytes_total | used only when graph Security display option is enabled | |
| destination_canonical_revision | all | |
| destination_canonical_service | all | |
| destination_cluster | all | |
| destination_principal | istio_requests_total | used only when graph Security display option is enabled |
| istio_request_messages_total | ||
| istio_response_messages_total | ||
| istio_tcp_received_bytes_total | ||
| istio_tcp_sent_bytes_total | ||
| destination_service | all | |
| destination_service_name | all | |
| destination_service_namespace | all | |
| destination_workload | all | |
| destination_workload_namespace | all | |
| grpc_response_status | istio_requests_total | used only when request_protocol=“grpc” |
| istio_request_bytes_sum | ||
| istio_request_duration_milliseconds_bucket | ||
| istio_request_duration_milliseconds_sum | ||
| istio_response_bytes_sum | ||
| reporter | all | both “source” and “destination” metrics are used by Kiali |
| request_operation | istio_requests_total | used only when request classification is configured. “request_operation” is the default attribute, it is configurable. |
| istio_request_bytes_sum | ||
| istio_response_bytes_sum | ||
| request_protocol | istio_requests_total | |
| istio_request_bytes_sum | ||
| istio_response_bytes_sum | ||
| response_code | istio_requests_total | |
| istio_request_bytes_sum | ||
| istio_request_duration_milliseconds_bucket | ||
| istio_request_duration_milliseconds_sum | ||
| istio_response_bytes_sum | ||
| response_flags | istio_requests_total | |
| istio_request_bytes_sum | ||
| istio_request_duration_milliseconds_bucket | ||
| istio_request_duration_milliseconds_sum | ||
| istio_response_bytes_sum | ||
| source_canonical_revision | all | |
| source_canonical_service | all | |
| source_cluster | all | |
| source_principal | istio_requests_total | |
| istio_request_messages_total | ||
| istio_response_messages_total | ||
| istio_tcp_received_bytes_total | ||
| istio_tcp_sent_bytes_total | ||
| source_workload | all | |
| source_workload_namespace | all |
Envoy metrics:
| Metric | Notes |
|---|---|
| envoy_cluster_upstream_cx_active | used in workload details |
| envoy_cluster_upstream_rq_total | used in workload details |
| envoy_listener_downstream_cx_active | used in workload details |
| envoy_listener_http_downstream_rq | used in workload details |
| envoy_server_memory_allocated | used in workload details |
| envoy_server_memory_heap_size | used in workload details |
| envoy_server_uptime | used in workload details |
What is the License?
See here for the Kiali license.
Why isn’t my namespace in the Namespace Selection dropdown?
Kiali can be told to restrict the namespaces users can see via the Kiali CR spec.deployment.discovery_selectors field. If there are no discovery selectors defined, Kiali will allow all namespaces unless deployment.cluster_wide_access is false, in which case only Kiali’s own namespace and the Istio control plane namespace will be accessible. If a namespace does not match one of the discovery selectors defined in the Kiali CR spec.deployment.discovery_selectors field at the time Kiali is installed by the operator it will not be visible in the Namespace Selection dropdown; if a new namespace is created after Kiali is installed and that namespace matches one of the discovery selectors, it will only be visible in the Namespace Selection dropdown after the operator creates the necessary Roles for the Kiali Server and restarts the Kiali Server pod (see Operator Namespace Watching). See the Namespace Management documentation for more information.
Note that Istio has its own set of optional discovery selectors that can be configured in the Istio MeshConfig discoverySelectors field, but these Istio discovery selectors are ignored by Kiali.
Kiali also caches namespaces by default for 10 seconds. Therefore, it might take up to the number of seconds specified by spec.kubernetes_config.cache_token_namespace_duration in order for a newly added namespace to be seen by Kiali.
Workload “is not found as” messages
Kiali queries Deployment ,ReplicaSet, ReplicationController, DeploymentConfig, StatefulSet, Job and CronJob controllers. Deployment, ReplicaSet and StatefulSet are always queried, but ReplicationController, DeploymentConfig, Job and CronJobs are excluded by default for performance reasons.
To include them, update the list of excluded_workloads from the Kiali config.
#    ---
#    excluded_workloads:
#    - "CronJob"
#    - "DeploymentConfig"
#    - "Job"
#    - "ReplicationController"
#
An empty list will tell Kiali to query all type of known controllers.
Why Health is not available for services using TCP protocol?
Health for Services is calculated based on success rate of traffic. The traffic of HTTP and GRPC protocols is request based and it is possible to inspect each request to check and extract response codes to determine how many requests succeeded and how many erred.
However, HTTP is a widely known protocol. Applications may use other less known protocols to communicate. For these cases, Istio logs the traffic as raw TCP (an opaque sequence of bytes) and is not analyzed. Thus, for Kiali it is not possible to know if any traffic have failed or succeeded and reports Health as unavailable.
Why are the control plane metrics missing from the control plane card?
The control plane metrics are fetched from the Prometheus configured in Kiali.
Kiali will fetch the memory and the CPU metrics related to the Istiod container (discovery) first and will fallback to the metrics related to the istiod process if it couldn’t find the container metrics. If the required metrics are not found then Kiali can not display the related charts or data.
The metrics used are:
| Metric | Notes |
|---|---|
| container_cpu_usage_seconds_total | used for Istiod’s discovery container CPU metric |
| container_memory_working_set_bytes | used for Istiod’s discovery container memory metric |
| process_cpu_seconds_total | used for Istiod process CPU metric |
| process_resident_memory_bytes | used for Istiod process memory metric |
5 - Graph
Why is my graph empty?
There are several reasons why a graph may be empty. First, make sure you have selected at least one namespace. Kiali will look for traffic into, out of, and within the selected namespaces. Another reason is that Istio is not actually generating the expected telemetry. This is typically an indication that workload pods have not been injected with the Istio sidecar proxy (Envoy proxy). But it can also mean that there is an issue with Prometheus configuration, and it is not scraping metrics as expected. To verify that telemetry is being reported to Prometheus, see this FAQ entry.
The primary reason a graph is empty is just that there is no measurable request traffic for the selected namespaces, for the selected time period. Note that to generate a request rate, at least two requests must be recorded, and that Kiali only records request rates >= .01 request-per-minute. Check your selection in the Duration dropdown, if it is small, like 1m, you may need to increase the time period to 5m or higher.
You can enable the “Idle Edges” Display option to include request edges that previously had traffic, but not during the requested time period. This is disabled by default to present a cleaner graph, but can be enabled to get a full picture of current and previous traffic.
Older versions of Kiali may show an empty graph for shorter duration options, depending on the Prometheus globalScrapeInterval configuration setting. For more, see this FAQ entry.
Why is my Duration dropdown menu missing entries?
The Duration menu for the graph, and also other pages, does not display invalid options based on the Prometheus configuration. Options greater than the tsdbRetentionTime do not make sense. For example, if Prometheus stores 7 days of metrics then Kiali will not show Duration options greater than 7 days.
More recently, Kiali also considers globalScrapeInterval. Because request-rate calculation requires a minimum of two data-points, Duration options less than 2 times the globalScrapeInterval will not be shown. For example, if Prometheus scrapes every 1m, the 1m Duration option will not be shown. Note that the default globalScrapeInterval for Helm installs of Prometheus is 1m (at the time of this writing).
Why are my TCP requests disconnected in the graph?
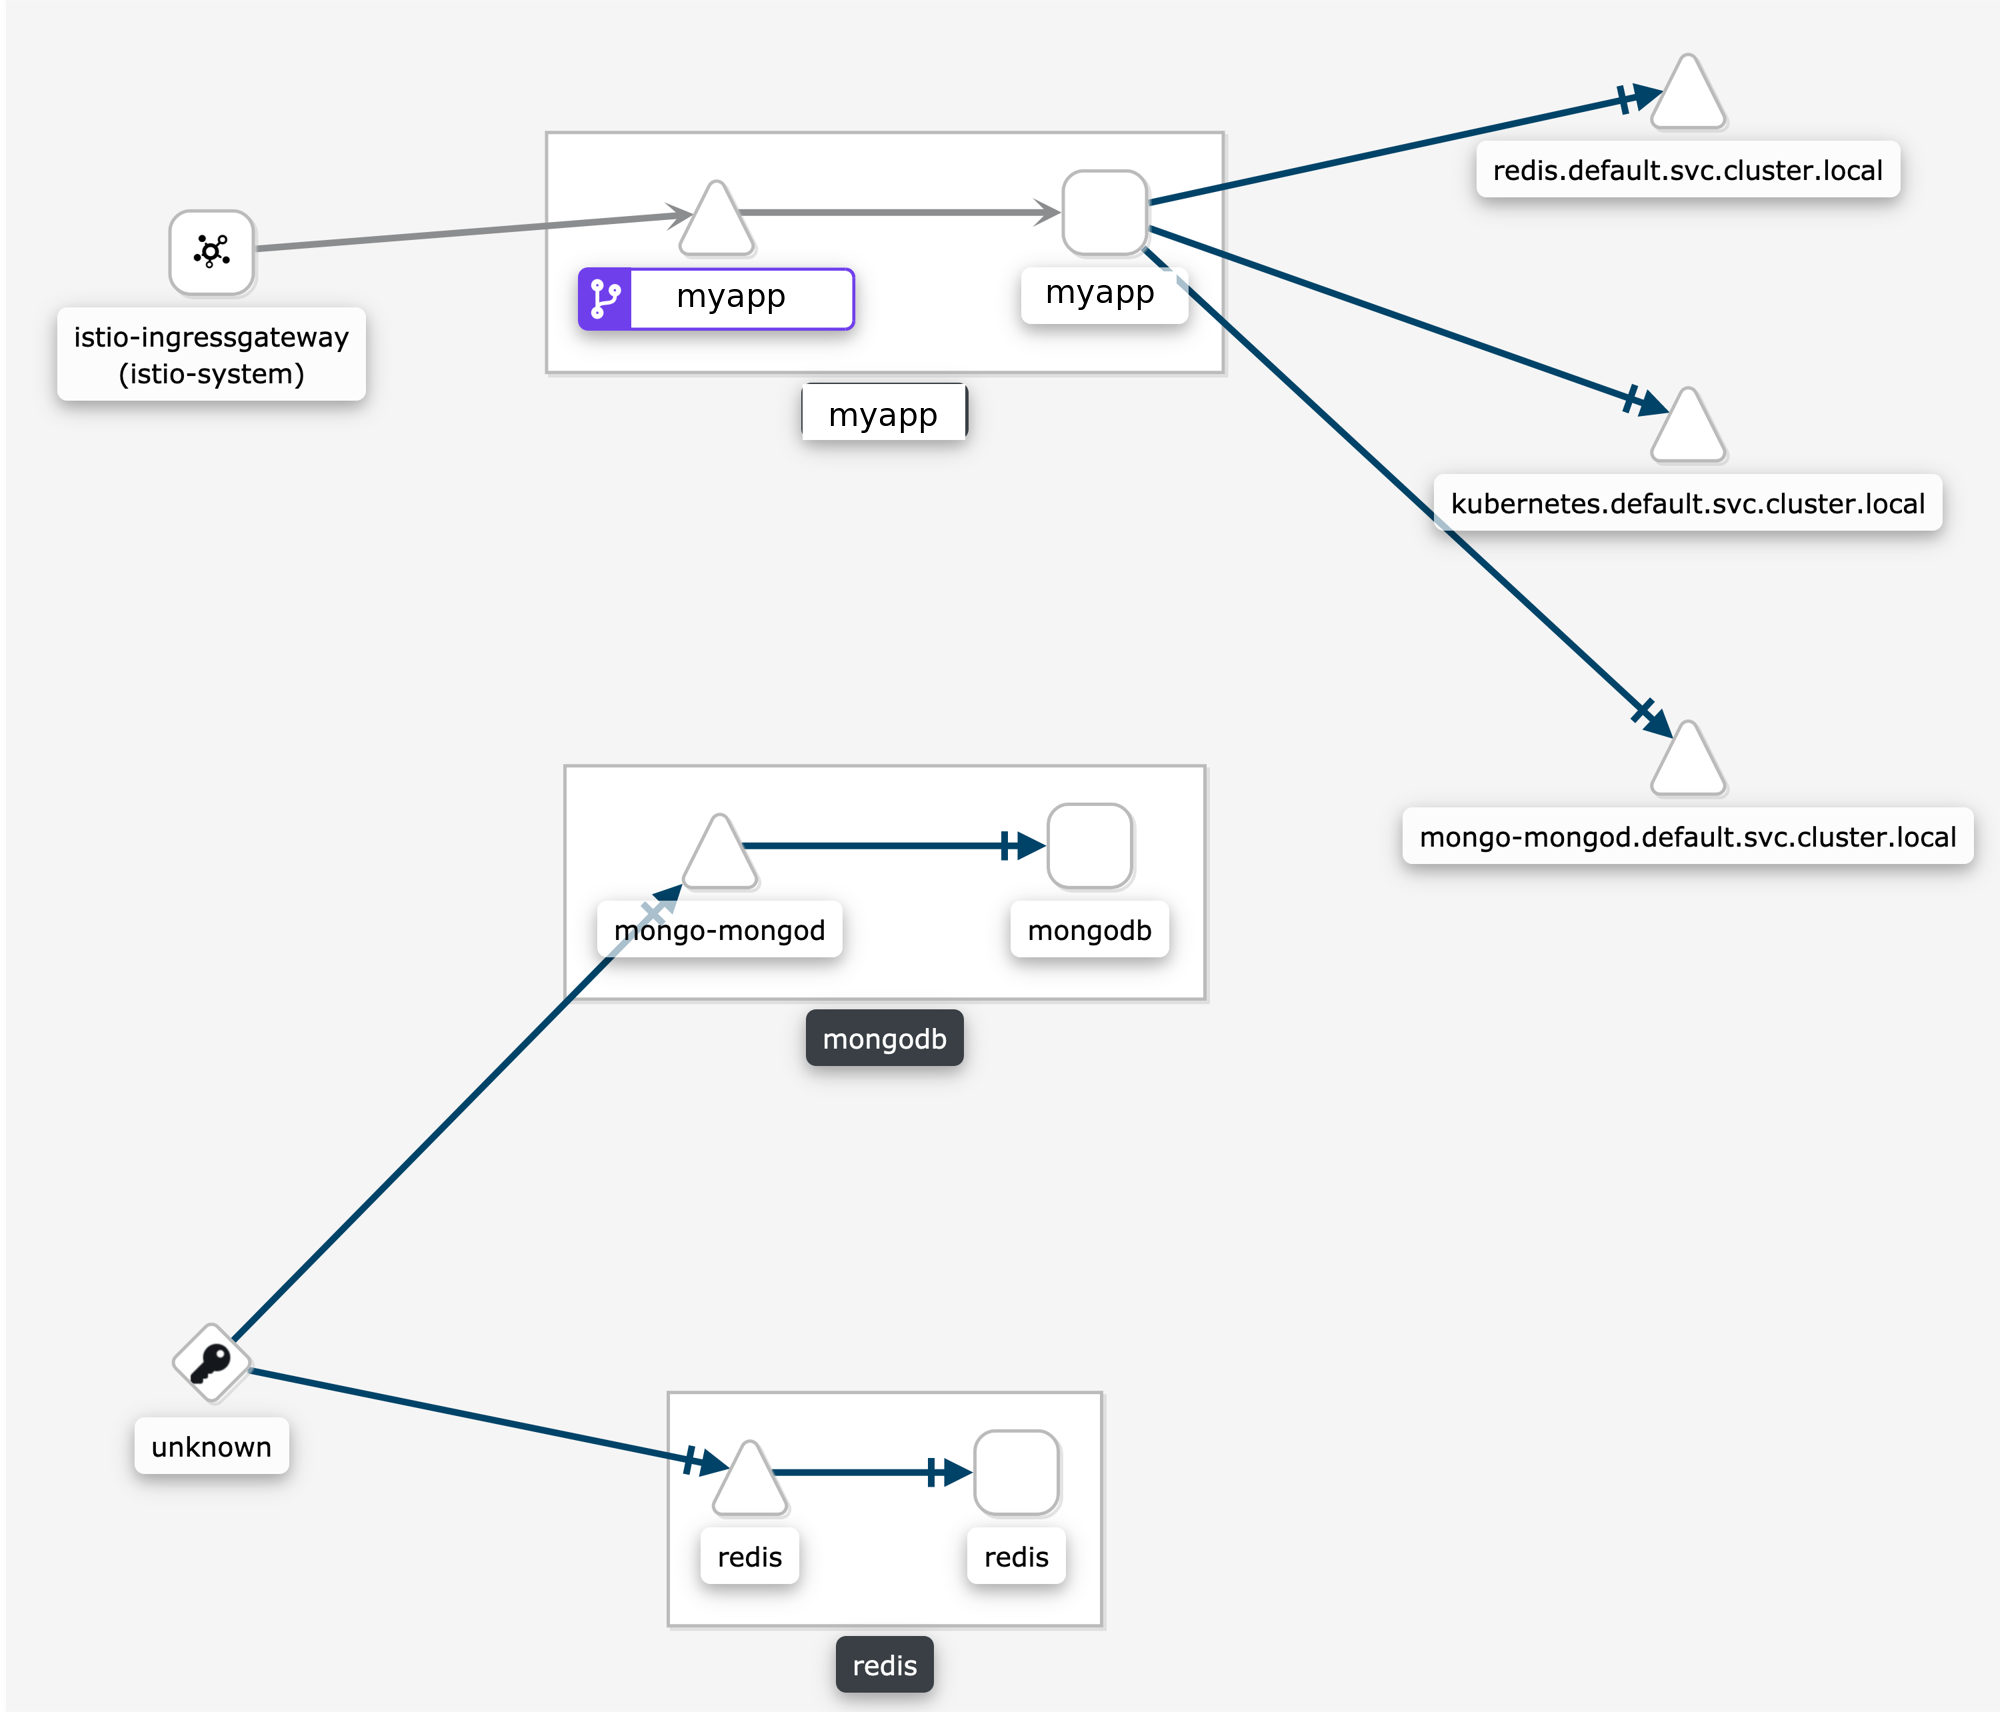
Some users are surprised when requests are not connected in the graph. This is normal Istio telemetry for TCP requests if mTLS is not enabled. For HTTP requests, the requests will be connected even without MTLS, because Istio uses headers to exchange workload metadata between source and destination. With the disconnected telemetry you will see an edge from a workload to a terminal service node. That’s the first hop. And then another edge from “Unknown” to the expected destination service/workload. In the graph below, this can be seen for the requests from myapp to redis and mongodb:
Why is my external HTTPS traffic showing as TCP?
Istio can’t recognize HTTPS request that go directly to the service, the reason is that these requests are encrypted and are recognized as TCP traffic.
You can however configure your mesh to use TLS origination for your egress traffic. This will allow to see your traffic as HTTP instead of TCP.
Why is the graph badly laid out?
The layout for Kiali Graph may render differently, depending on the data to display (number of graph nodes and their interactions) and it’s sometimes difficult, not to say impossible, to have a single layout that renders nicely in every situation. That’s why Kiali offers a choice of several layout algorithms. However, we may still find some scenarios where none of the proposed algorithms offer a satisfying display. If Kiali doesn’t render your graph layout in a satisfactory manner please switch to another layout option. This can be done from the Graph Toolbar located on the bottom left of the graph. Note that you can select different layouts for the whole graph, and for inside the namespace boxes.
If Kiali doesn’t produce a good graph for you, don’t hesitate to open an issue in GitHub or reach out via the usual channels.
Why are there many unknown nodes in the graph?
In some situations you can see a lot of connections from an “Unknown” node to your services in the graph, because some software external to your mesh might be periodically pinging or fetching data. This is typically the case when you setup Kubernetes liveness probes, or have some application metrics pushed or exposed to a monitoring system such as Prometheus. Perhaps you wouldn’t like to see these connections because they make the graph harder to read.
From the Graph page, you can filter them out by typing node = unknown in the Graph Hide input box.

For a more definitive solution, you could have these endpoints (like /health or /metrics) exposed on a different port and server than your main application, and to not declare this port in your Pod’s container definition as containerPort. This way, the requests will be completely ignored by the Istio proxy, as mentioned in Istio documentation (at the bottom of that page).
Why do I have missing edges?
Kiali builds the graph from Istio’s telemetry. If you don’t see what you expect it probably means that it has not been reported in Prometheus. This usually means that:
1- The requests are not actually sent.
2- Sidecars are missing.
3- Requests are leaving the mesh and are not configured for telemetry.
For example, If you don’t see traffic going from node A to node B, but you are sure there is traffic, the first thing you should be doing is checking the telemetry by querying the metrics, for example, if you know that MyWorkload-v1 is sending requests to ServiceA try looking for metrics of the type:
istio_requests_total{destination_service="ServiceA"}
If telemetry is missing then it may be better to take it up with Istio.
Which lock icons should I see when I enable the Kiali Graph Security Display option?
Sometimes the Kiali Graph Security Display option causes confusion. The option is disabled by default for optimal performance, but enabling the option typically adds nominal time to the graph rendering. When enabled, Kiali will determine the percentage of mutual TLS (mTLS) traffic on each edge. Kiali will only show lock icons on edges with traffic for edges that have > 0% mTLS traffic.
Kiali determines the mTLS percentage for the edges via the connection_security_policy attribute in the
Prometheus telemetry. Note that this is destination telemetry (i.e. reporter="destination").
Why can’t I see traffic leaving the mesh?
See Why do I have missing edges?, and additionally consider whether you need to create a ServiceEntry (or several) to allow the requests to be mapped correctly.
You can check this article on how to visualize your external traffic in Kiali for more information.
Why do I see traffic to PassthroughCluster?
Requests going to PassthroughCluster (or BlackHoleCluster) are requests that did not get routed to a defined service or service entry, and instead end up at one of these built-in Istio request handlers. See Monitoring Blocked and Passthrough External Service Traffic for more information.
Unexpected routing to these nodes does not indicate a Kiali problem, you’re seeing the actual routing being performed by Istio. In general it is due to a misconfiguration and/or missing Istio sidecar. Less often but possible is an actual issue with the mesh, like a sync issue or evicted pod.
Use Kiali’s Workloads list view to ensure sidecars are not missing. Use Kiali’s Istio Config list view to look for any config validation errors.
How do I inspect the underlying metrics used to generate the Kiali Graph?
It is not uncommon for the Kiali graph to show traffic that surprises the user. Often the thought is that Kiali may have a bug. But in general Kiali is just visualizing the metrics generated by Istio. The next thought is that the Istio telemetry generation may have a bug. But in general Istio is generating the expected metrics given the defined configuration for the application.
To determine whether there is an actual bug it can be useful to look directly at the metrics collected by and stored in the Prometheus database. Prometheus provides a basic console that can be opened using the istioctl dashboard command:
> istioctl dashboard prometheus
The above command, assuming Istio and Prometheus are in the default istio-system namespace, should open the Prometheus console in your browser.
Kiali uses a variety of metrics but the primary request traffic metrics for graph generation are these:
- istio_requests_total
- istio_tcp_sent_bytes_total
The Prometheus query language is very rich but a few basic queries is often enough to gather time-series of interest.
Here is a query that returns time-series for HTTP or GRPC requests to the reviews service in Istio’s BookInfo sample demo:
istio_requests_total{reporter="source", destination_service_name="reviews"}
And here is an example of the results:
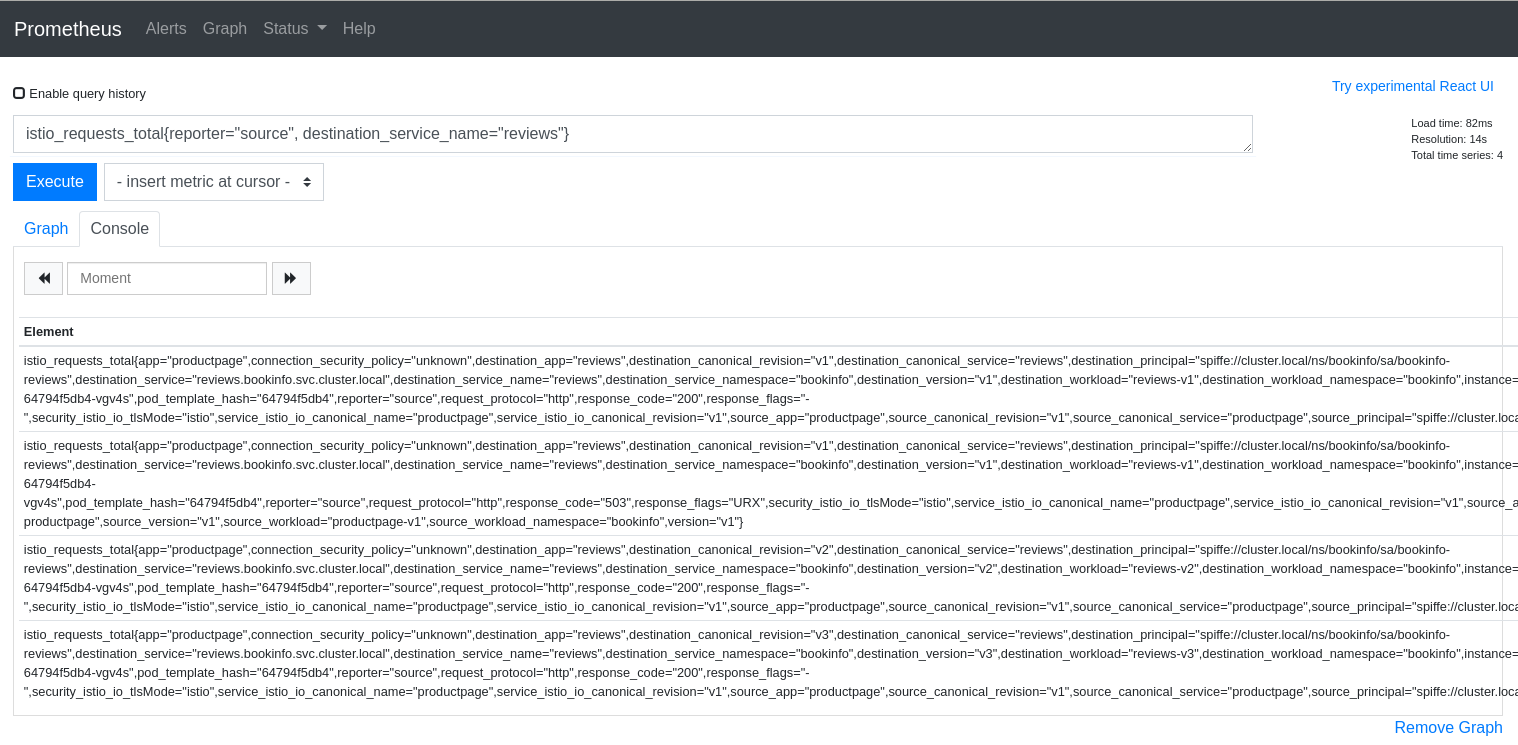
The query above is good for dumping all of the attributes but it can be useful to aggregate results by desired attributes. The next query will get the request counts for the reviews service broken down by source and destination workloads:
sum(istio_requests_total{reporter="source", destination_service_name="reviews"}) by (source_workload, destination_workload)

The first step to explaining your Kiali graph is to inspect the metrics used to generate the graph. Kiali devs may ask for this info when working with you to solve a problem, so it is useful to know how to get to the Prometheus console.
Why don’t I see response times on my service graph?
Users can select Response Time to label their edges with 95th percentile response times. The response time indicates the amount of time it took for the destination workload to handle the request. In the Kiali graph the edges leading to service nodes represent the request itself, in other words, the routing. Kiali can show the request rate for a service but response time is not applicable to be shown on the incoming edge. Only edges to app, workload, or service entry nodes show response time because only those nodes represent the actual work done to handle the request. This is why a Service graph will typically not show any response time information, even when the Response Time option is selected.
Because Service graphs can show Service Entry nodes the Response Time option is still a valid choice. Edges to Service Entry nodes represent externally handled requests, which do report the response time for the external handling.
Why does my workload graph show service nodes?
Even when Display Service Nodes is disabled a workload graph can show service nodes. Display Service Nodes ensures that you will see the service nodes between two other nodes,
providing an edge to the destination service node, and a subsequent edge to the node handling the request. This option injects service nodes where they previously would not be
shown. But Kiali will always show a terminal service node when the request itself fails to be routed to a destination workload. This ensures the graph visualizes problem areas.
This can happen in a workload or app graph. Of course in a service graph the Display Service Nodes option is simply ignored.
In Kiali v2.x, is the old graph still available?
The “old graph” is the Cytoscape implementation. The “new graph” is the PatternFly implementation. In Kiali v2.0 the new PatternFly graph implementation became the default, and the old Cytoscape implementation was deprecated. In Kiali v2.8, the old Cytoscape graph implementation has been completely removed and is no longer available.
6 - Installation
What is the difference between the operator and the server helm chart?
There are two installation mechanisms from which you can choose when installing the Kiali Server. The first is the recommended installation mechanism - the Kiali Operator. The second installation mechanism is the server helm chart. There are some features that you get with the Kiali Operator that you do not get with the server helm chart. The main differences between the two are mentioned below, though this list may be incomplete.
-
The operator watches for changes to the multi-cluster remote cluster secret - if a change is detected, the operator automatically rolls out a new Kiali server pod so the server picks up the changes immediately. See the multi-cluster docs for more details.
-
Both the operator and server helm chart support disabling cluster-wide-access mode (
deployment.cluster_wide_access=false) - see the Namespace Management docs for details. However, when using the server helm chart withdeployment.cluster_wide_access=false, there are some lifecycle management features that only the operator provides (see the list below), so you may need to manually clean up resources when changing these configurations via the server helm chart. To avoid this, uninstall and reinstall the Kiali server rather than usinghelm upgradewhen modifying these settings.- The operator automatically cleans up Roles/RoleBindings from namespaces that are no longer accessible when discovery selectors (
deployment.discovery_selectors.default) change - The operator handles transitions when
view_only_modeorauth.strategysettings change (RoleBindings are immutable and must be deleted/recreated) - The operator explicitly cleans up ClusterRole/ClusterRoleBinding resources when switching from
cluster_wide_access=truetofalse - The operator adds labels to accessible namespaces to mark which Kiali instance manages them
- The operator automatically cleans up Roles/RoleBindings from namespaces that are no longer accessible when discovery selectors (
Operator fails due to cannot list resource "clusterroles" error
When the Kiali Operator installs a Kiali Server, the Operator will assign the Kiali Server the proper roles/rolebindings so the Kiali Server can access the appropriate namespaces.
The Kiali Operator will check to see if the Kiali CR setting deployment.cluster_wide_access is set to true (which is the default value if it is unset). If it is, this means the Kiali Server is to be given access to all namespaces in the cluster, including namespaces that will be created in the future. In this case, the Kiali Operator will create and assign ClusterRole/ClusterRoleBinding resources to the Kiali Server. But in order to be able to do this, the Kiali Operator must itself be given permission to create those ClusterRole and ClusterRoleBinding resources. When you install the Kiali Operator via OLM, these permissions are automatically granted. However, if you installed the Kiali Operator with the Operator Helm Chart, and if you did so with the value clusterRoleCreator
set to false then the Kiali Operator will not be given permission to create cluster roles. In this case, you will be unable to install a Kiali Server if your Kiali CR does not have deployment.cluster_wide_access set to true (and, again, this is the default if unspecified). You will get an error similar to this:
Failed to list rbac.authorization.k8s.io/v1, Kind=ClusterRole:
clusterroles.rbac.authorization.k8s.io is forbidden:
User "system:serviceaccount:kiali-operator:kiali-operator"
cannot list resource "clusterroles" in API group
"rbac.authorization.k8s.io" at the cluster scope
Thus, if you do not give the Kiali Operator the permission to create cluster roles, you must tell the Operator which specific namespaces the Kiali Server can access. When specific namespaces are specified in deployment.discovery_selectors.default, the Kiali Operator will create Role and RoleBindings (not the “Cluster” kinds) and assign them to the Kiali Server.
What values can be set in the Kiali CR?
A Kiali CR is used to tell the Kiali Operator how and where to install a Kiali Server in your cluster. You can install one or more Kiali Servers by creating one Kiali CR for each Kiali Server you want the Operator to install and manage. Deleting a Kiali CR will uninstall its associted Kiali Server.
Most options are described in the pages of the Installation and Configuration sections of the documentation.
If you cannot find some configuration, check the Kiali CR Reference, which briefly describes all available options along with an example CR and all default values. If you are using a specific version of the Operator prior to 1.46, the Kiali CR that is valid for that version can be found in the version tag within the github repository (e.g. Operator v1.25.0 supported these Kiali CR settings).
How to configure some operator features at runtime
Once the Kiali Operator is installed, you can change some of its configuration at runtime in order to utilize certain features that the Kiali Operator provides. These features are configured via environment variables defined in the operator’s deployment.
Perform the following steps to configure these features in the Kiali Operator:
- Determine the namespace where your operator is located and store that namespace name in
$OPERATOR_NAMESPACE. If you installed the operator via helm, it may bekiali-operator. If you installed the operator via OLM, it may beopenshift-operators. If you are not sure, you can perform a query to find it:
OPERATOR_NAMESPACE="$(kubectl get deployments --all-namespaces | grep kiali-operator | cut -d ' ' -f 1)"
- Determine the name of the environment variable you need to change in order to configure the feature you are interested in. Here is a list of currently supported environment variables you can set:
ALLOW_AD_HOC_KIALI_NAMESPACE: must betrueorfalse. Iftrue, the operator will be allowed to install the Kiali Server in any namespace, regardless of which namespace the Kiali CR is created. Iffalse, the operator will only install the Kiali Server in the same namespace where the Kiali CR is created - any attempt to do otherwise will cause the operator to abort the Kiali Server installation.ALLOW_AD_HOC_KIALI_IMAGE: must betrueorfalse. Iftrue, the operator will be allowed to install the Kiali Server with a custom container image as defined in the Kiali CR’sspec.deployment.image_nameand/orspec.deployment.image_version. Iffalse, the operator will only install the Kiali Server with the default image. If a Kiali CR is created withspec.deployment.image_nameorspec.deployment.image_versiondefined, the operator will abort the Kiali Server installation.ALLOW_AD_HOC_CONTAINERS: must betrueorfalse. Iftrue, the operator will be allowed to install additional containers and init containers into the Kiali pod as defined in the Kiali CR’sspec.deployment.additional_pod_containers_yamlandspec.deployment.additional_pod_init_containers_yaml. Iffalse, the operator will not allow any additional containers or init containers to be configured so if a Kiali CR is created withspec.deployment.additional_pod_containers_yamlorspec.deployment.additional_pod_init_containers_yamldefined, the operator will abort the Kiali Server installation.ALLOW_SECURITY_CONTEXT_OVERRIDE: must betrueorfalse. Iftrue, the operator will be allowed to install the Kiali Server container with a fully customizable securityContext as defined by the user in the Kial CR. Iffalse, the operator will only allow the user to add settings to the securityContext; any attempt to override the default settings in the securityContext will be ignored.ALLOW_ALL_ACCESSIBLE_NAMESPACES: must betrueorfalse. Iftrue, the operator will allow the user to configure Kiali to access all namespaces in the cluster (i.e. will allow a Kiali CR to havespec.deployment.cluster_wide_accessset totrue). Iffalse, all Kiali CRs must setspec.deployment.cluster_wide_accesstofalse.ANSIBLE_DEBUG_LOGS: must betrueorfalse. Whentrue, turns on debug logging within the Operator SDK. For details, see the docs here.ANSIBLE_VERBOSITY_KIALI_KIALI_IO: Controls how verbose the operator logs are - the higher the value the more output is logged. For details, see the docs here.ANSIBLE_CONFIG: must be/etc/ansible/ansible.cfgor/opt/ansible/ansible-profiler.cfg. If set to/opt/ansible/ansible-profiler.cfga profiler report will be dumped in the operator logs after each reconciliation run.WATCHES_YAML: must be either (a)watches-os.yaml, (b)watches-os-ns.yaml, (c)watches-k8s.yamlor (d)watches-k8s-ns.yaml. If the operator is running on OpenShift, this value must be either (a) or (b); likewise, if the operator is running on a non-OpenShift Kubernetes cluster, this value must be either (c) or (d). If you require the operator to automatically update the Kiali Server with access to new namespaces created in the cluster, set this value to one of the-nsfiles (e.g.watches-os-ns.yamlorwatches-k8s-ns.yaml). This changes the default behavior of the operator such that it will watch for new namespaces getting created and will automatically set up the Kiali Server with the proper access to the new namespace (if such access is to be granted). This namespace watching is not necessary ifspec.deployment.cluster_wide_accessis set totruein the Kiali CR.
- Store the name of the environment variable you want to change in
$ENV_NAME:
ENV_NAME="ANSIBLE_CONFIG"
- Store the new value of the environment variable in
$ENV_VALUE:
ENV_VALUE="/opt/ansible/ansible-profiler.cfg"
- The final step depends on how you installed the Kiali Operator:
oc. If you are using a non-OpenShift Kubernetes environment, simply substitute all the oc references to kubectl.
- If you installed the operator via helm, simply set the environment variable on the operator deployment directly:
oc -n ${OPERATOR_NAMESPACE} set env deploy/kiali-operator "${ENV_NAME}=${ENV_VALUE}"
- If you installed the operator via OLM, you must set this environment variable within the operator’s CSV and let OLM propagate the new environment variable value down to the operator deployment:
oc -n ${OPERATOR_NAMESPACE} patch $(oc -n ${OPERATOR_NAMESPACE} get csv -o name | grep kiali) --type=json -p "[{'op':'replace','path':"/spec/install/spec/deployments/0/spec/template/spec/containers/0/env/$(oc -n ${OPERATOR_NAMESPACE} get $(oc -n ${OPERATOR_NAMESPACE} get csv -o name | grep kiali) -o jsonpath='{.spec.install.spec.deployments[0].spec.template.spec.containers[0].env[*].name}' | tr ' ' '\n' | cat --number | grep ${ENV_NAME} | cut -f 1 | xargs echo -n | cat - <(echo "-1") | bc)/value",'value':"\"${ENV_VALUE}\""}]"
How can I inject an Istio sidecar in the Kiali pod?
By default, Kiali will not have an Istio sidecar. If you wish to deploy the Kiali pod with a sidecar, you have to define the sidecar.istio.io/inject=true label in the spec.deployment.pod_labels setting in the Kiali CR. In addition, to ensure the sidecar and Kiali server containers start in the correct order, the Istio annotation proxy.istio.io/config should be defined in the spec.deployment.pod_annotations setting in the Kiali CR. For example:
spec:
  deployment:
    pod_labels:
      sidecar.istio.io/inject: "true"
    pod_annotations:
      proxy.istio.io/config: '{ "holdApplicationUntilProxyStarts": true }'
If you are utilizing CNI in your Istio environment (for example, on OpenShift), Istio will not allow sidecars to work when injected in pods deployed in the control plane namespace, e.g. istio-system. (1) (2) (3). In this case, you must deploy Kiali in its own separate namespace. On OpenShift, you can do this using the following instructions.
Determine what namespace you want to install Kiali and create it. Give the proper permissions to Kiali. Create the necessary NetworkAttachmentDefinition. Finally, create the Kiali CR that will tell the operator to install Kiali in this new namespace, making sure to add the proper sidecar injection label as explained earlier.
NAMESPACE="kialins"

oc create namespace ${NAMESPACE}

oc adm policy add-scc-to-group privileged system:serviceaccounts:${NAMESPACE}

cat <<EOM | oc apply -f -
apiVersion: k8s.cni.cncf.io/v1
kind: NetworkAttachmentDefinition
metadata:
  name: istio-cni
  namespace: ${NAMESPACE}
EOM

cat <<EOM | oc apply -f -
apiVersion: kiali.io/v1alpha1
kind: Kiali
metadata:
  name: kiali
  namespace: ${NAMESPACE}
spec:
  auth:
    strategy: anonymous
  deployment:
    pod_labels:
      sidecar.istio.io/inject: "true"
EOM
After the operator installs Kiali, confirm you have two containers in your pod. This indicates your Kiali pod has its proxy sidecar successfully injected.
$ oc get pods -n ${NAMESPACE}
NAME                    READY   STATUS    RESTARTS   AGE
kiali-56bbfd644-nkhlw   2/2     Running   0          43s
How can I specify a container image digest hash when installing Kiali Server and Kiali Operator?
To tell the operator to install a specific container image using a digest hash, you must use the deployment.image_digest setting in conjunction with the deployment.image_version setting. deployment.image_version is simply the digest hash code and deployment.image_digest is the type of digest (most likely you want to set this value to sha256). So for example, in your Kiali CR you will want something like this:
spec:
  deployment:
    image_version: 63fdb9a9a1aa8fea00015c32cd6dbb63166046ddd087762d0fb53a04611e896d
    image_digest: sha256
Leaving deployment.image_digest unset or setting it to an empty string will tell the operator to assume the deployment.image_version is a tag.
For those that opt not to use the operator to install the server but instead use the server helm chart, the same deployment.image_version and deployment.image_digest values are supported by the Kiali server helm chart.
As for the operator itself, when installing the operator using its helm chart, the values image.tag and image.digest are used in the same manner as the deployment.image_version and deployment.image_digest as explained above. So if you wish to install the operator using a container image digest hash, you will want to use the image.tag and image.digest in a similar way:
helm install --set image.tag=7336eb77199a4d737435a8bf395e1666b7085cc7f0ad8b4cf9456b7649b7d6ad --set image.digest=sha256 ...and the rest of the helm install options...
How can I use a CSI Driver to expose a custom secret to the Kiali Server?
You first must already have a CSI driver and provider installed in your cluster and a valid SecretProviderClass deployed in the namespace where Kiali is installed.
To mount a secret exposed by the CSI Driver, you can use the custom_secret configuration to supply the CSI volume source on the pod. The Kiali CR reference docs have an example. The Kiali Operator or server helm chart will automatically expose the secret as a volume mount into the container at the specified mount location.
Although Kiali retrieves the secret over the Kubernetes API, mounting the secret is required for the CSI Driver to create the backing Kubernetes secret.
Note that the custom_secrets optional flag is ignored when mounting secrets from the CSI provider. The secrets are required to exist - then cannot be optional.
How can I use a secret to pass external service credentials to the Kiali Server?
You can use secrets to store the credentials that Kiali must use to authenticate to external services such as Prometheus. How you configure Kiali is dependent upon whether you install the Kiali Server using the Kiali Operator or the Kiali Server Helm Chart.
When Using Kiali Operator
If you are installing using the Kiali Operator, simply set the credential setting to secret:<secretName>:<secretKey>. For details, see the Kiali CR reference docs.
For example, here is how you can set the bearer token that Kiali will use to authenticate with the Prometheus server.
- Create a secret with the token.
kubectl -n istio-system create secret generic my-secret --from-literal=my-cred=abc123
- Edit the Kiali CR and specify the
tokenfield with the valuesecret:my-secret:my-credand specify the type asbearerto indicate that authentication will be done with a bearer token.
spec:
  external_services:
    prometheus:
      auth:
        type: bearer
        token: secret:my-secret:my-cred
At this point, the Kiali Server will soon restart and be reconfigured to authenticate to Prometheus with the given token.
If the secret contains a password, as opposed to a token, set type to basic to indicate that Kiali should authenticate using basic authentication using the given username and password you specify in the configuration:
spec:
  external_services:
    prometheus:
      auth:
        type: basic
        username: my-user-name
        password: secret:my-secret:my-cred
For certificate-based authentication (e.g., mTLS to ACM Observability Service), reference certificate files from a secret containing TLS certificates:
spec:
  external_services:
    prometheus:
      auth:
        type: none  # No bearer token, just mTLS
        cert_file: secret:acm-certs:tls.crt
        key_file: secret:acm-certs:tls.key
Note that you can share a secret across multiple external services if they use the same credentials, or you can create multiple secrets if you need to use different credentials for the different external services.
The secret: pattern works for both simple credential values (tokens, passwords, usernames) and file-based credentials (certificates and keys). For certificate files, the secret key name (e.g., tls.crt, tls.key) will be preserved when mounted.
You can use secrets as explained above for the following fields in the Kiali CR:
spec.external_services.grafana.auth.cert_filespec.external_services.grafana.auth.key_filespec.external_services.grafana.auth.passwordspec.external_services.grafana.auth.tokenspec.external_services.grafana.auth.usernamespec.external_services.perses.auth.cert_filespec.external_services.perses.auth.key_filespec.external_services.perses.auth.passwordspec.external_services.perses.auth.usernamespec.external_services.prometheus.auth.cert_filespec.external_services.prometheus.auth.key_filespec.external_services.prometheus.auth.passwordspec.external_services.prometheus.auth.tokenspec.external_services.prometheus.auth.usernamespec.external_services.tracing.auth.cert_filespec.external_services.tracing.auth.key_filespec.external_services.tracing.auth.passwordspec.external_services.tracing.auth.tokenspec.external_services.tracing.auth.usernamespec.external_services.custom_dashboards.prometheus.auth.cert_filespec.external_services.custom_dashboards.prometheus.auth.key_filespec.external_services.custom_dashboards.prometheus.auth.passwordspec.external_services.custom_dashboards.prometheus.auth.tokenspec.external_services.custom_dashboards.prometheus.auth.usernamespec.login_token.signing_key
When Using Kiali Server Helm Chart
The Kiali Server Helm Chart supports the same secret:<secretName>:<secretKey> syntax as the Kiali Operator. The Helm chart automatically detects when you use this pattern and mounts the referenced secret into the Kiali pod.
For example, to configure Prometheus authentication using a secret:
- Create a secret with your credentials:
kubectl -n istio-system create secret generic my-prometheus-creds --from-literal=password=abc123xyz789
- Create a Helm values file that references the secret using the
secret:pattern:
external_services:
  prometheus:
    auth:
      type: basic
      username: my-user
      password: "secret:my-prometheus-creds:password"
- Install with the Kiali Server Helm Chart using that values file. For example, to install in the istio-system namespace:
helm install -f my-values.yaml -n istio-system kiali-server kiali/kiali-server
The Helm chart will automatically mount the secret and configure Kiali to read the credentials from the mounted file. When you start the Kiali Server, you should see a debug message in its logs that says:
Credential file path configured: [/kiali-override-secrets/prometheus-password/value.txt]
NOTE: You must have enabled logging at the debug level to see the above message in the logs.
For certificate-based authentication, use the same secret: pattern:
external_services:
  prometheus:
    auth:
      type: none
      cert_file: "secret:my-tls-certs:tls.crt"
      key_file: "secret:my-tls-certs:tls.key"
For certificate files, the secret key name (e.g., tls.crt, tls.key) is preserved in the mounted file path.
external_services.grafana.enabled=true, external_services.custom_dashboards.enabled=true). Prometheus credentials are always processed regardless of any enabled flag.
<instance-name>-cabundle, not per-service via secrets.
How does Kiali handle automatic credential rotation?
Kiali supports automatic credential rotation without requiring a pod restart. This applies to all secret-backed credentials including tokens, passwords, usernames, and certificate files.
How it works:
-
Kubernetes Secret Update: When an external system (cert-manager, ACM, OpenShift service CA, etc.) updates a Kubernetes secret, Kubernetes automatically updates the mounted files in the Kiali pod within approximately 60 seconds.
-
Read-on-Use Pattern: Kiali reads credentials from the mounted files each time they are needed, not just at startup. This means updated credentials are automatically picked up.
-
No Pod Restart: Because credentials are read dynamically, there’s no need to restart the Kiali pod when secrets are rotated.
Timing expectations:
When a secret or ConfigMap is updated in Kubernetes, there are two phases before Kiali uses the new values:
-
Kubernetes volume sync (0-60 seconds): The kubelet periodically syncs mounted secrets and ConfigMaps to the pod’s filesystem. By default, this happens every 60 seconds (controlled by the kubelet’s
syncFrequencysetting). In the worst case, you may wait up to 60 seconds for the files to be updated on disk. -
Kiali file detection (near-instant): Once Kubernetes updates the files, Kiali’s filesystem watcher (fsnotify) detects the change immediately and reloads the credentials.
In practice, expect credential updates to take effect within 0-90 seconds after updating the secret, depending on where you are in the kubelet’s sync cycle. If your cluster administrator has configured a different syncFrequency, adjust expectations accordingly.
Which credentials support auto-rotation:
All credentials mounted from secrets support automatic rotation:
- Tokens (
auth.token) - Passwords (
auth.password) - Usernames (
auth.username) - Client certificates (
auth.cert_file) - Client private keys (
auth.key_file) - Login token signing key (
login_token.signing_key)
kiali-cabundle ConfigMap (either the global additional-ca-bundle.pem key or a component-specific key such as openid-server-ca.crt). See the TLS Configuration page for details. The deprecated per-service auth.ca_file setting is ignored. To rotate CA certificates, update the ConfigMap content and Kubernetes will refresh the projected volume automatically.
Note: Credentials specified as literal values in the Kiali CR (not using the secret: pattern) are loaded at startup and do not support automatic rotation.
7 - Istio Component Status
How can I add one component to the list?
If you are interested in adding one more component to the Istio Component Status tooltip, you have the option to add one new component into the
Kiali CR, under the spec.external_services.istio.component_status field.
For each component there, you will need to specify the app label of the deployment’s pods, the namespace and whether is a core component or add-on.
One component is ‘Not found’ but I can see it running. What can I do?
The first thing you should do is check the Kiali CR for the spec.external_services.istio.component_status field (see the reference documentation here)
Kiali looks for a Deployment for which its pods have the app label with the specified value in the CR, and lives in that namespace.
The app label name may be changed from the default (app) and it is specified in the spec.istio_labels.app_label_name in the Kiali CR.
Ensure that you have specified correctly the namespace and that the deployment’s pod template has the specified label.
One component is ‘Unreachable’ but I can see it running. What can I do?
Kiali considers one component as Unreachable when the component responds to a GET request with a 4xx or 5xx response code.
The URL where Kiali sends a GET request to is the same as it is used for the component consumption. However, Kiali allows you to set a specific URL for health check purposes: the health_check_url setting.
In this example, Kiali uses the Prometheus url for both metrics consumption and health checks.
external_services:
  prometheus:
    url: "http://prometheus.istio-system:9090"
In case that the prometheus.url endpoint doesn’t return 2XX/3XX to GET requests, you can use the following settings to specify which health check URL Kiali should use:
external_services:
  prometheus:
    health_check_url: "http://prometheus.istio-system:9090/healthz"
    url: "http://prometheus.istio-system:9090"
Please read the Kiali CR Reference for more information. Each external service component has its own health_check_url and is_core setting to tailor the experience in the Istio Component Status feature.
8 - Performance and Scalability
What are some Tips for working with a large mesh?
It can be an observability challenge to work with a large mesh. Here are a few things that can be done to improve the situation.
Resources and Connectivity
Before talking about Kiali features, it is important to understand that Kiali’s performance is dependent on the performance and responsiveness of your metrics database (typically Prometheus), and your tracing store, for installations using tracing. For Prometheus scalability tips, see Prometheus Tuning. See Tempo Tuning if using Tempo for your trace store.
Only when query performance for metrics and traces is good, can Kiali respond in a reasonable way. So, it is also important to provide sufficient connectivity for the API calls to return information in a timely way.
Manual Refresh
By default, Kiali will immediately attempt to populate the page, the default being the Overview page. After the initial page is rendered, most pages will automatically refresh, based on the setting in the “Refresh Interval” dropdown. The default is every 60s. For a large mesh, even the initial page load can be slow, and it can be frustrating if you have to wait for the page to render before being able to enter desired options and/or filters, and then ask for another refresh.
In the dropdown, Kiali offers the “Manual” refresh setting. If selected, Kiali will not refresh the page on a timer. Kiali also offers a “Pause” setting. “Pause” also prevents a timed refresh, but it will refresh on an option or filter change. “Manual” will only refresh on a manual click of the refresh button. To ensure that even the initial page load is avoided, the default can be set in the Kiali CR:spec.kiali_feature_flags.ui_defaults.refresh_interval: manual. With this setting it is possible to “batch” settings changes. For example, when working with the graph you could choose namespaces, update Display settings, and also change Traffic settings, all before rendering the graph.
URL Bookmarks
Kiali pages store most, if not all, of their settings as URL query parameters. So, it can be useful to bookmark pages you’ve configured with desired options and filters. By visiting the bookmarked page those options and filters will be applied immediately.
Large Graphs
Working with large graphs is difficult. A graph does not have to be very large before it becomes complicated and/or dense. Here are a few suggestions.
Tips to reduce graph size and speed up generation
- Limit the namespaces selected.
- Each requested namespace is like its own graph request, and then each resulting namespace graph is “stitched” together.
- This may not be possible, in some mesh designs even a single namespace is very populated.
- Reduce the protocols selected
- Using the Traffic dropdown, only fetch TCP or HTTP, not both. Different queries are performed for the different protocols.
- In Ambient, you can also choose between ztunnel and waypoint telemetry. This can reduce the number of queries and/or the size of your graph.
- Prefer smaller Duration dropdown values.
- The larger the duration, the more metric data that must be processed.
- Enable response time edge labels only after minimizing the size of your graph.
- This requires extra queries against Prometheus histograms, and can be expensive.
- Enable the Security Display option only after minimizing the size of your graph.
- This requires extra Prometheus queries.
- Disable the Service Nodes Display option, if not needed.
- This is enabled by default, and provides valuable routing information, but it does also add extra nodes and edges.
- Disable the Virtual Services Display option, if not needed.
- This will take away some of the graph decoration but stops the need to interact with k8s API/objects, which can be heavy.
- Prefer workload graph type
- This graph type often renders more quickly than other graph types.
- Only enable Operation Nodes as needed.
- This option is very valuable when using request classification, but does require extra queries, and does add extra nodes and edges.
Tips for manipulating your graph
After your graph is generated and rendered in the UI, there are client-side ways to improve your visualization:
- Graph Find and Hide
- Find and Hide are very valuable tools. Both use the same simple query language, described in detail in the on-screen help (click the info icon next to the inputs, on the toolbar). It is highly recommended to become familiar with this feature, very simple expressions can be useful.
- Find will highlight the nodes and edges that match the expression. This can help locate nodes and edges in a large graph (or even a small graph).
- Hide will temporarily remove the matching nodes and edges. This can effectively clean up a large graph into a very focused view.
- It is possible to pre-define Find and Hide expressions in your Kiali CR. These pre-defined expressions can even be configured to be applied automatically.
- For more, see find_options and hide_options in the Kiali CR Reference.
- Layouts
- Kiali provides multiple layouts. Many graphs looks best using the default layout, but others may improve using a different layout.
- Layouts are available by clicking the on-screen icons at the bottom of the graph.
Mini-Graphs
One way to avoid a large graph is to avoid it completely. Instead, navigate to a specific object of interest. The detail page offers a mini-graph, centered on the specific service, app or workload. Clicking a node on the mini-graph navigates to that node’s detail page. Mini-graphs tend to generate quickly because they are much more specific than a namespace graph. You can also navigate from the mini-graph back to the main graph, or a node graph. The node graph is similar to the mini-graph but offers all of the main graph options.
Graph Caching
Graph caching was added starting with Kiali v2.21. It caches, with background re-compute, the most recent namespace graph per session. The initial graph is generated synchonously, and is placed in the cache. Due to the vast number of options, there is no easy way to pre-compute the initial graph before it is requested by the user. The graph will then be re-computed in the background with a frequency related to the refresh interval set by the user on the graph page. The larger the interval the less often the graph is re-computed. Subsequent requests for the same graph will return the most recently computed cache entry, and so it should return quickly. The cache entry is evicted if the graph options change, or if the cache is not hit for the configured “inactivity_timeout” duration. This allows a user to navigate away in the UI, and when returning to the graph find that it is ready and updated.
A few notes:
- Different tabs in the same browser, for the same user, share a session and therefore a cache entry.
- Anonymous login strategy is session-less. and so all anonymous logins share a cache entry.
- This feature is considered beta-level, and it’s configuration is not yet part of the CRD schema. Here is the relevant configuration, with the default settings:
spec:
  kiali_internal:
    graph_cache:
      enabled: true
      inactivity_timeout: "10m"
      max_cache_memory_mb: 1000
      refresh_interval: "60s"
What performance and scalability measurements are done?
Performance tests are conducted on setups with 10, 50, 200, 300, 500, and 800 namespaces. Each namespace contains:
- 1 Service
- 2 Workloads
- 2 Istio configurations
What improvements have been made to Kiali’s performance in recent versions?
Performance data is collected using automated performance tests on various setups, ensuring a comprehensive evaluation of improvements. Since the release of Kiali v1.80, significant performance enhancements have been implemented, resulting in up to a 5x improvement in page load times. The performance improvements were achieved by reducing the number of requests made from the Kiali UI to the services. Instead of multiple requests, the process was streamlined to unify these into a single request per cluster. The enhanced performance significantly reduces the time users spend waiting for pages to load, leading to a more efficient and smooth user experience.
Performance Improvements Matrix Per Kiali Version And Section
Kiali |
Section |
Improvements |
|---|---|---|
| 1.80 | Graph Page | Validations |
| 1.81 | Overview Page | mTLS, Metrics, Health |
| 1.82 | Applications List | Overall loading |
| 1.83 | Workloads List, Services List | Overall loading |
These improvements make Kiali more responsive and efficient, particularly in environments with a large number of namespaces, services, and workloads, enhancing usability and productivity.
For a graphical representation of the performance improvements between Kiali v1.79 (before improvements) and v1.85 (after improvements) of the Overview page load times, refer to the chart below:
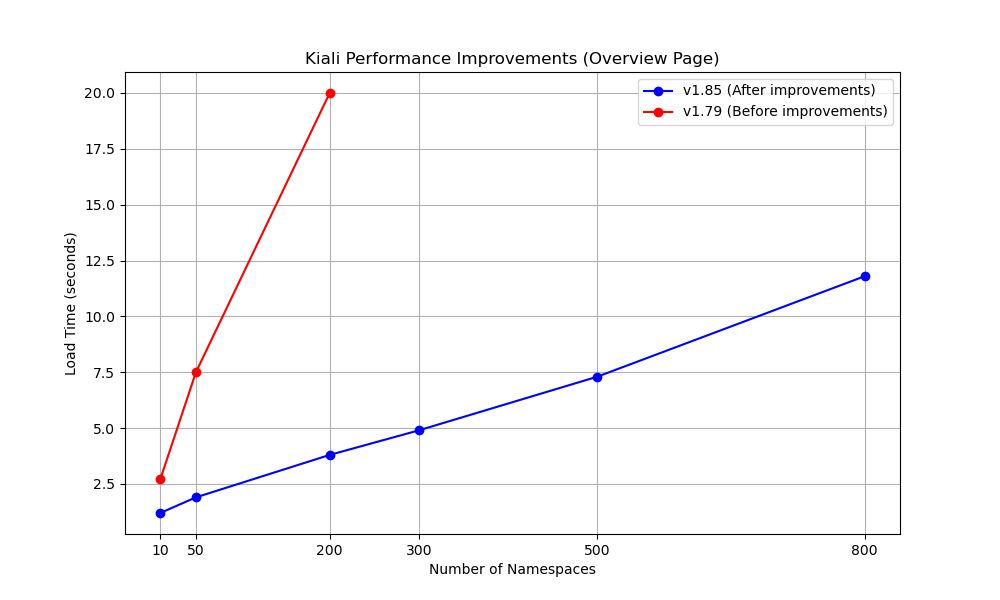
9 - Validations
Which formats does Kiali support for specifying hosts?
Istio highly recommends that you always use fully qualified domain names (FQDN) for hosts in DestinationRules. However, Istio does allow you to use other formats like short names (details or details.bookinfo). Kiali only supports FQDN and simple service names as host formats: for example details.bookinfo.svc.cluster.local or details. Validations using the details.bookinfo format might not be accurate.
In the following example it should show the validation of “More than one Destination Rule for the same host subset combination”. Because of the usage of the short name reviews.bookinfo Kiali won’t show the warning message on both destination rules.
apiVersion: networking.istio.io/v1alpha3
kind: DestinationRule
metadata:
  name: reviews-dr1
spec:
  host: reviews
  trafficPolicy:
    loadBalancer:
      simple: RANDOM
  subsets:
  - name: v1
    labels:
      version: v1
  - name: v2
    labels:
      version: v2
  - name: v3
    labels:
      version: v3
---
apiVersion: networking.istio.io/v1alpha3
kind: DestinationRule
metadata:
  name: reviews-dr2
spec:
  host: reviews
  trafficPolicy:
    loadBalancer:
      simple: RANDOM
  subsets:
  - name: v1
    labels:
      version: v1
See the recomendation Istio gives regarding host format: “To avoid potential misconfigurations, it is recommended to always use fully qualified domain names over short names.”
For best results with Kiali, you should use fully qualified domain names when specifying hosts.